
Page 22 - SPEMD_61-2
P. 22
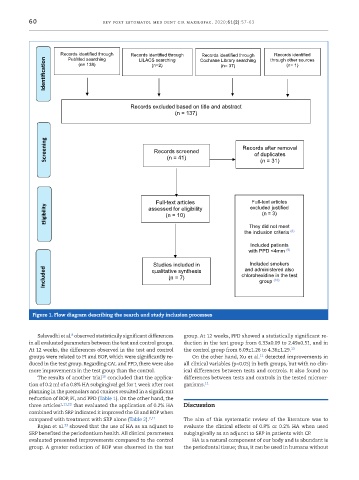
60           Figure 1 – Flow diagram describing the search and study inclusion processes.
                                   rev port estomatol med dent cir maxilofac. 2020;61(2):57-63


                     Records identified through   Records identified through   Cochrane Library searching   through other sources
                                                                                            Records identified
                                                                    Records identified through
                Identification      (n= 138)       (n=2)                  (n= 37)               (n= 1)
                        PubMed searching
                                               LILACS searching


                                            Records excluded based on title and abstract
                                                           (n = 137)


                Screening                           Records screened             Records after removal

                                                                                     of duplicates
                                                        (n = 41)
                                                                                       (n = 31)


                                                     Full-text articles             excluded justified
                                                                                     Full-text articles
                Eligibility                       assessed for eligibility              (n = 3)
                                                        (n = 10)
                                                                                    They did not meet
                                                                                  the inclusion criteria  (8)

                                                                                    Included patients
                                                                                   with PPD <4mm
                                                                                                (9)
                                                                                    Included smokers
                                                    Studies included in           and administered also
                Included                                 (n = 7)                 chlorohexidine in the test
                                                   qualitative synthesis
                                                                                       group
                                                                                            (10)


            Figure 1. Flow diagram describing the search and study inclusion processes


                         8
             Salavadhi et al.  observed statistically significant differences   group. At 12 weeks, PPD showed a statistically significant re-
           in all evaluated parameters between the test and control groups.   duction in the test group from 6.33±0.09 to 2.49±0.51, and in
           At 12 weeks, the differences observed in the test and control   the control group from 6.09±1.26 to 4.36±1.29. 13
                                                                                       11
           groups were related to PI and BOP, which were significantly re-  On the other hand, Xu et al.  detected improvements in
           duced in the test group. Regarding CAL and PPD, there were also   all clinical variables (p<0.05) in both groups, but with no clin-
           more improvements in the test group than the control.  ical differences between tests and controls. It also found no
                                   10
             The results of another trial  concluded that the applica-  differences between tests and controls in the tested microor-
           tion of 0.2 ml of a 0.8% HA subgingival gel for 1 week after root   ganisms. 11
           planning in the premolars and canines resulted in a significant
           reduction of BOP, PI, and PPD (Table 1). On the other hand, the
           three articles 2,11,13  that evaluated the application of 0.2% HA   Discussion
           combined with SRP indicated it improved the GI and BOP when
           compared with treatment with SRP alone (Table 2). 2,11  The aim of this systematic review of the literature was to
                      13
             Rajan et al.  showed that the use of HA as an adjunct to   evaluate the clinical effects of 0.8% or 0.2% HA when used
           SRP benefited the periodontium health. All clinical parameters   subgingivally as an adjunct to SRP in patients with CP.
           evaluated presented improvements compared to the control   HA is a natural component of our body and is abundant is
           group. A greater reduction of BOP was observed in the test   the periodontal tissue; thus, it can be used in humans without