
Page 35 - SPEMD_59-1
P. 35
rev port estomatol med dent cir maxilofac . 2018;59(1):24-29 27
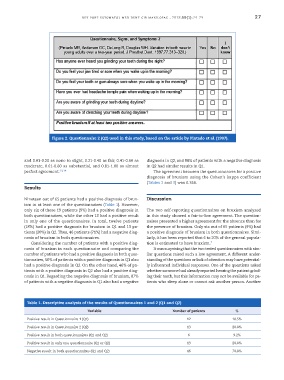
Figure 2. Questionnaire 2 (Q2) used in this study, based on the article by Pintado et al. (1997). 2
and 0.01-0.20 as none to slight, 0.21-0.40 as fair, 0.41-0.60 as diagnosis in Q2, and 88% of patients with a negative diagnosis
moderate, 0.61-0.80 as substantial, and 0.81-1.00 as almost in Q2 had similar results in Q1.
perfect agreement. 13,14 The agreement between the questionnaires for a positive
diagnosis of bruxism using the Cohen’s kappa coefficient
(Tables 2 and 3) was 0.356.
Results
Nineteen out of 65 patients had a positive diagnosis of brux- Discussion
ism in at least one of the questionnaires (Table 1). However,
only six of these 19 patients (9%) had a positive diagnosis in The two self-reporting questionnaires on bruxism analyzed
both questionnaires, while the other 13 had a positive result in this study showed a fair-to-low agreement. The question-
in only one of the questionnaires. In total, twelve patients naires presented a higher agreement for the absence than for
(18%) had a positive diagnosis for bruxism in Q1 and 13 pa- the presence of bruxism. Only six out of 65 patients (9%) had
tients (20%) in Q2. Thus, 46 patients (71%) had a negative diag- a positive diagnosis of bruxism in both questionnaires. Simi-
nosis of bruxism in both questionnaires. larly, it has been reported that 6 to 20% of the general popula-
Considering the number of patients with a positive diag- tion is estimated to have bruxism. 7
nosis of bruxism in each questionnaire and comparing the It was surprising that the two tested questionnaires with sim-
number of patients who had a positive diagnosis in both ques- ilar questions raised such a low agreement. A different under-
tionnaires, 50% of patients with a positive diagnosis in Q1 also standing of the questions or lack of attention may have potential-
had a positive diagnosis in Q2. On the other hand, 46% of pa- ly influenced individual responses. One of the questions asked
tients with a positive diagnosis in Q2 also had a positive diag- whether someone had already reported hearing the patient grind-
nosis in Q1. Regarding the negative diagnosis of bruxism, 87% ing their teeth, but this information may not be available for pa-
of patients with a negative diagnosis in Q1 also had a negative tients who sleep alone or cannot ask another person. Another
Table 1. Descriptive analysis of the results of Questionnaires 1 and 2 (Q1 and Q2)
Variable Number of patients %
Positive result in Questionnaire 1 (Q1) 12 18.5%
Positive result in Questionnaire 2 (Q2) 13 20.0%
Positive result in both questionnaires (Q1 and Q2) 6 9.2%
Positive result in only one questionnaire (Q1 or Q2) 13 20.0%
Negative result in both questionnaires (Q1 and Q2) 46 70.8%