


Page 21 - SPEMD_62-3
P. 21
rev port estomatol med dent cir maxilofac . 2021;62(3):141-149         147


                                                                Table 3. Descriptive statistics, before and after tooth
                                                                bleaching, by study group. Mean values and standard
                                                                deviation of color coordinates L*a*b*, WI , ΔE , and
                                                                                                D
                                                                                                   00
                                                                ΔWI  are presented for each group regarding all teeth
                                                                   D
                                                                and only teeth classified as equal or darker than A3.5 by
                                                                VITA Classical. [1 – Before treatment; 2 – After treatment;
                                                                * – Intergroup statistically significant differences for
                                                                independent t ‑test (P<0.01) with α=0.05.]
                                                                         Group 1 – Vaseline  Group 2 – Block ‑out
                                                                             n=10                 n=10
                                                                       All teeth    Teeth VITA   All teeth  Teeth VITA
                                                                        n=120     ≥ A3.5     n=120     ≥ A3.5
                                                                                   n=28                n=28
                                                                L1     72.5±2.5   69.8±1.3  72.8±2.7  70.2±1.8
                                                                a1      3.5±1.4   5.4±0.8   3.6±1.3    5.2±0.8
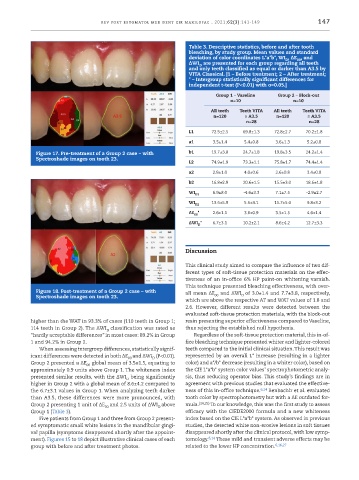
             Figure 17. Pre ‑treatment of a Group 2 case – with   b1   19.7±3.8   24.7±1.8  19.8±3.5  24.2±1.4
             Spectroshade images on tooth 23.
                                                                L2     74.9±1.9   73.3±1.1  75.8±1.7  74.4±1.4
                                                                a2      2.8±1.0   4.0±0.6   2.6±0.8    3.4±0.8
                                                                b2     16.8±2.9   20.6±1.5  15.5±3.0  18.6±1.8
                                                                WI D1   6.9±8.0    -4.6±3.3  7.1±7.5    -2.9±2.7
                                                                WI     13.6±5.9   5.6±3.1   15.7±5.0   9.8±3.2
                                                                  D2
                                                                ΔE *    2.6±1.1   3.6±0.9   3.5±1.5    4.6±1.4
                                                                 00
                                                                ΔWI *   6.7±3.1   10.2±2.1  8.6±4.2   12.7±3.3
                                                                   D


                                                               Discussion

                                                               This clinical study aimed to compare the influence of two dif-
                                                               ferent types of soft-tissue protection materials on the effec-
                                                               tiveness of an in-office 6% HP paint-on whitening varnish.
                                                               This technique presented bleaching effectiveness, with over-
             Figure 18. Post ‑treatment of a Group 2 case – with   all mean ΔE  and ΔWI of 3.0±1.4 and 7.7±3.8, respectively,
             Spectroshade images on tooth 23.                           00       D
                                                               which are above the respective AT and WAT values of 1.8 and
                                                               2.6. However, different results were detected between the
                                                               evaluated soft-tissue protection materials, with the block-out
           higher than the WAT in 93.3% of cases (110 teeth in Group 1;   resin presenting superior effectiveness compared to Vaseline,
           114 teeth in Group 2). The ΔWI classification was rated as   thus rejecting the established null hypothesis.
                                    D
           “hardly acceptable differences” in most cases: 89.2% in Group   Regardless of the soft-tissue protection material, this in-of-
           1 and 94.2% in Group 2.                             fice bleaching technique presented whiter and lighter-colored
              When assessing intergroup differences, statistically signif-  teeth compared to the initial clinical situation. This result was
           icant differences were detected in both ΔE and ΔWI  (P<0.01).   represented by an overall L* increase (resulting in a lighter
                                           00       D
           Group 2 presented a ΔE  global mean of 3.5±1.5, equating to   color) and a*/b* decrease (resulting in a whiter color), based on
                              00
           approximately 0.9 units above Group 1. The whiteness index   the CIE L*a*b* system color values’ spectrophotometric analy-
           presented similar results, with the ΔWI  being significantly   sis, thus reducing operator bias. This study’s findings are in
                                           D
           higher in Group 2 with a global mean of 8.6±4.2 compared to   agreement with previous studies that evaluated the effective-
           the 6.7±3.1 values in Group 1. When analyzing teeth darker   ness of this in-office technique. 6,14  Benbachir et al. evaluated
           than A3.5, these differences were more pronounced, with   tooth color by spectrophotometry but with a ΔE outdated for-
           Group 2 presenting 1 unit of ΔE and 2.5 units of ΔWI above   mula. (14,25)  To our knowledge, this was the first study to assess
                                                     D
                                    00
           Group 1 (Table 3).                                  efficacy with the CIEDE2000 formula and a new whiteness
              Five patients from Group 1 and three from Group 2 present-  index based on the CIE L*a*b* system. As observed in previous
           ed symptomatic small white lesions in the mandibular gingi-  studies, the detected white non-erosive lesions in soft tissues
           val papilla (symptoms disappeared shortly after the appoint-  disappeared shortly after the clinical protocol, with low symp-
           ment). Figures 15 to 18 depict illustrative clinical cases of each   tomology. 6,14  These mild and transient adverse effects may be
           group with before and after treatment photos.       related to the lower HP concentration. 6,16,27

