
Page 11 - SPEMD_62-1
P. 11
rev port estomatol med dent cir maxilofac . 2021;62(1):1-8 5
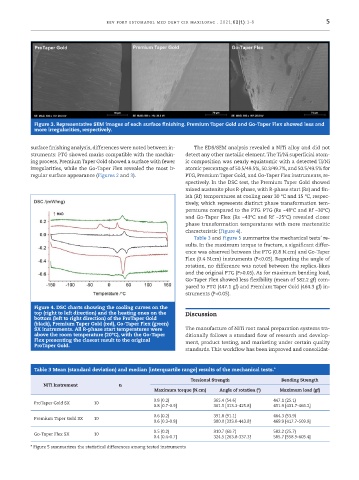
Figure 3. Representative SEM images of each surface finishing. Premium Taper Gold and Go -Taper Flex showed less and
more irregularities, respectively.
surface finishing analysis, differences were noted between in- The EDS/SEM analysis revealed a NiTi alloy and did not
struments: PTG showed marks compatible with the machin- detect any other metallic element. The Ti/Ni superficial atom-
ing process, Premium Taper Gold showed a surface with fewer ic composition was nearly equiatomic with a detected Ti/Ni
irregularities, while the Go -Taper Flex revealed the most ir- atomic percentage of 50.5/49.5%, 50.3/49.7%, and 50.5/49.5% for
regular surface appearance (Figures 2 and 3). PTG, Premium Taper Gold, and Go -Taper Flex instruments, re-
spectively. In the DSC test, the Premium Taper Gold showed
mixed austenite plus R -phase, with R -phase start (Rs) and fin-
ish (Rf) temperatures at cooling near 30 ºC and 15 ºC, respec-
tively, which represents distinct phase transformation tem-
peratures compared to the PTG. PTG (Rs ~48ºC and Rf ~30ºC)
and Go -Taper Flex (Rs ~43ºC and Rf ~25ºC) revealed closer
phase transformation temperatures with more martensitic
characteristic (Figure 4).
Table 3 and Figure 5 summarize the mechanical tests’ re-
sults. In the maximum torque to fracture, a significant differ-
ence was observed between the PTG (0.8 N.cm) and Go -Taper
Flex (0.4 N.cm) instruments (P<0.05). Regarding the angle of
rotation, no difference was noted between the replica -likes
and the original PTG (P>0.05). As for maximum bending load,
Go -Taper Flex showed less flexibility (mean of 582.2 gf) com-
pared to PTG (447.1 gf) and Premium Taper Gold (464.3 gf) in-
struments (P<0.05).
Figure 4. DSC charts showing the cooling curves on the
top (right to left direction) and the heating ones on the Discussion
bottom (left to right direction) of the ProTaper Gold
(black), Premium Taper Gold (red), Go -Taper Flex (green)
SX instruments. All R -phase start temperatures were The manufacture of NiTi root canal preparation systems tra-
above the room temperature (20ºC), with the Go -Taper ditionally follows a standard flow of research and develop-
Flex presenting the closest result to the original ment, product testing, and marketing under certain quality
ProTaper Gold.
standards. This workflow has been improved and consolidat-
Table 3 Mean (standard deviation) and median [interquartile range] results of the mechanical tests.*
Torsional Strength Bending Strength
NiTi Instrument n
Maximum torque (N.cm) Angle of rotation (º) Maximum load (gf)
0.8 (0.2) 365.4 (54.6) 447.1 (25.1)
ProTaper Gold SX 10
0.8 [0.7 -0.9] 361.5 [313.3 -425.8] 451.9 [431.7 -466.2]
0.6 (0.2) 391.8 (91.1) 464.3 (53.9)
Premium Taper Gold SX 10
0.6 [0.3 -0.8] 380.0 [333.0 -443.8] 469.9 [417.7 -509.9]
0.5 (0.2) 310.7 (60.7) 582.2 (25.7)
Go -Taper Flex SX 10
0.4 [0.4 -0.7] 324.5 [263.8 -337.3] 585.7 [558.9 -605.4]
* Figure 5 summarizes the statistical differences among tested instruments