
Page 10 - SPEMD_62-1
P. 10
4 rev port estomatol med dent cir maxilofac. 2021;62(1):1-8
proximately 2 minutes, followed by neutralization with dis- 45º. The maximum load (in gram/force [gf]) required to induce
tilled water. Then, they were weighed on an M -Power the 45º displacement was assessed in the Tesc v3.04 software
microbalance (Sartorius, Goettingen, Germany). Two alumi- (Mattest Automação e Informática, Brazil).
num pans (38 mg and 5 -mm inner diameter) were prepared, All collected data was introduced in the SPSS software (IBM
one with the fragments to be tested and the other empty SPSS Statistics Version 22, Chicago, IL, USA). The dependent
(control). The thermal cycle test was conducted on a differen- variables of maximum torque, angle of rotation, and maxi-
tial scanning calorimeter (DSC 204 F1 Phoenix; Netzsch- mum bending load were submitted to analytical analysis. The
-Gerätebau GmbH, Selb, Germany) under a gaseous nitrogen assumption of normality was assessed using the Shapiro -Wilk
atmosphere and comprised: (a) heating from room tempera- test. The results were determined in mean and standard devi-
ture to +150 ºC, (b) holding this temperature for 2 min, (c) ations or median and interquartile range. The helix angle, an-
cooling to -150 ºC, (d) holding this temperature for 2 min, (e) gle of rotation, and maximum bending load results were com-
heating to +150 ºC, (f) holding this temperature for 2 min and pared using the one -way ANOVA and post hoc Tukey tests, while
(g) cooling to room temperature. Heating and cooling rates the Kruskal -Wallis test was chosen for the maximum torque.
were 10 K/min. The final data were assessed using the Netzsch The significance level was set at 0.05.
Proteus Thermal Analysis (Netzsch -Gerätebau GmbH) soft-
ware, from which the R -phase start (Rs) and R -phase finish
(Rf) temperatures were extracted. In each group, the DSC test Results
was performed twice, for the repetition to confirm the results
of the first test. The stereomicroscopic analysis showed similarities among
The SX instruments’ mechanical performance was deter- the three tested SX instruments regarding the number of
mined by torsional and bending tests at room temperature (20 blades and helix angle (P>0.05), while no major defects or
ºC) following international specifications. 11,12 Prior to each test, deformations were detected (Table 2). The SEM assessment
the brand new instruments were visually inspected under ste- confirmed the blade’s symmetry, with no radial lands and
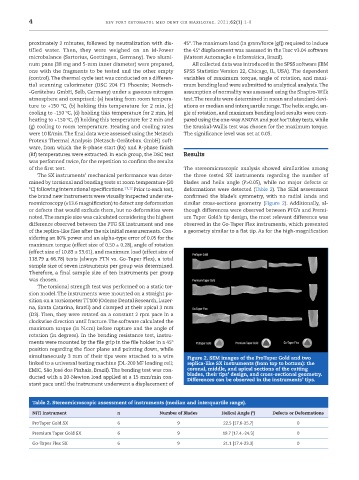
reomicroscopy (×13.6 magnification) to detect any deformation similar cross -sections geometry (Figure 2). Additionally, al-
or defects that would exclude them, but no deformities were though differences were observed between PTG’s and Premi-
noted. The sample size was calculated considering the highest um Taper Gold’s tip design, the most relevant difference was
difference observed between the PTG SX instrument and one observed in the Go -Taper Flex instruments, which presented
of the replica -like files after the six initial measurements. Con- a geometry similar to a flat tip. As for the high -magnification
sidering an 80% power and an alpha -type error of 0.05 for the
maximum torque (effect size of 0.50 ± 0.28), angle of rotation
(effect size of 10.83 ± 53.61), and maximum load (effect size of
118.79 ± 66.78) tests (always PTN vs. Go -Taper Flex), a total
sample size of seven instruments per group was determined.
Therefore, a final sample size of ten instruments per group
was chosen.
The torsional strength test was performed on a static tor-
sion model. The instruments were mounted on a straight po-
sition on a torsiometer TT100 (Odeme Dental Research, Luzer-
na, Santa Catarina, Brazil) and clamped at their apical 3 mm
(D3). Then, they were rotated on a constant 2 rpm pace in a
clockwise direction until fracture. The software calculated the
maximum torque (in N.cm) before rupture and the angle of
rotation (in degrees). In the bending resistance test, instru-
ments were mounted by the file grip in the file holder in a 45º
position regarding the floor plane and pointing down, while
simultaneously 3 mm of their tips were attached to a wire Figure 2. SEM images of the ProTaper Gold and two
linked to a universal testing machine (DL -200 MF loading cell; replica -like SX instruments (from top to bottom): the
EMIC, São José dos Pinhais, Brazil). The bending test was con- coronal, middle, and apical sections of the cutting
ducted with a 20 -Newton load applied at a 15 mm/min con- blades, their tips’ design, and cross -sectional geometry.
Differences can be observed in the instruments’ tips.
stant pace until the instrument underwent a displacement of
Table 2. Stereomicroscopic assessment of instruments (median and interquartile range).
NiTi Instrument n Number of Blades Helical Angle (º) Defects or Deformations
ProTaper Gold SX 6 9 22.5 [17.6 -25.7] 0
Premium Taper Gold SX 6 9 19.7 [17.4. -24.3] 0
Go -Taper Flex SX 6 9 21.1 [17.4 -23.3] 0