
Page 11 - SPEMD_60-4
P. 11
rev port estomatol med dent cir maxilofac . 2019;60(4):155-162 159
a stereomicroscope and classified as adhesive, cohesive or
mixed: adhesive if it occurred between the reline resin and the
denture base resin, cohesive when it occurred exclusively with-
in one of the resins, and mixed if it occurred in the interface of
the two resins but included residues of reline resin.
Since normality was not verified (Shapiro-Wilk normality
tests, p<0.05), γ and μTBS data were submitted to Kruskal-Wal-
lis and Mann-Whitney nonparametric tests (α=0.05). Failure
mode data were analyzed with chi-square tests (α=0.05).
Results
The total surface free energy values (Table 2) ranged between
41.9 mN/m, in the Ufi Gel Hard loaded with 5% CHX, and 32.1
mN/m, in the Kooliner without CHX.
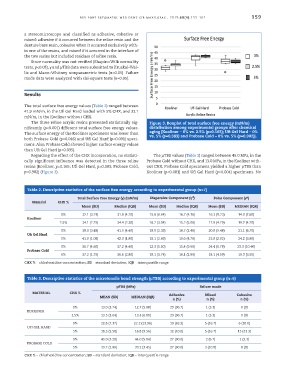
The three reline acrylic resins presented statistically sig- Figure 3. Boxplot of total surface free energy (mN/m)
nificantly (p<0.001) different total surface free energy values. distribution among experimental groups after chemical
The surface energy of the Kooliner specimens was lower than aging [Kooliner – 0% vs. 2.5% (p=0.165); Ufi Gel Hard – 0%
vs. 5% (p=0.383) and Probase Cold – 0% vs. 5% (p=0.902)].
both Probase Cold (p=0.046) and Ufi Gel Hard (p<0.001) speci-
mens. Also, Probase Cold showed higher surface energy values
than Ufi Gel Hard (p=0.035).
Regarding the effect of the CHX incorporation, no statisti- The µTBS values (Table 3) ranged between 45.0 MPa, in the
cally significant influence was detected in the three reline Probase Cold without CHX, and 13.0 MPa, in the Kooliner with-
resins (Kooliner, p=0.165; Ufi Gel Hard, p=0.383; Probase Cold, out CHX. Probase Cold specimens yielded a higher µTBS than
p=0.902) (Figure 3). Kooliner (p<0.001) and Ufi Gel Hard (p=0.004) specimens. No
Table 2. Descriptive statistics of the surface free energy according to experimental group (n=7)
p
d
Total Surface Free Energy (γ) (mN/m) Dispersive Component (γ ) Polar Component (γ )
Material CHX %
Mean (SD) Median (IQR) Mean (SD) Median (IQR) Mean (SD) MEDIAN (IQR)
0% 32.1 (3.19) 31.8 (4.20) 15.8 (6.64) 16.7 (4.30) 16.3 (9.23) 14.0 (7.60)
Kooliner
2.5% 34.1 (2.25) 34.4 (2.30) 16.2 (3.04) 15.2 (5.00) 17.9 (4.79) 19.2 (4.20)
0% 39.9 (3.48) 41.5 (4.40) 19.0 (2.39) 18.7 (2.40) 20.8 (5.48) 21.1 (6.70)
Ufi Gel Hard
5% 41.9 (1.09) 42.0 (1.80) 18.1 (2.69) 19.0 (4.70) 23.8 (2.92) 24.2 (3.80)
0% 36.7 (4.60) 37.2 (4.40) 12.3 (5.50) 15.4 (9.50) 24.4 (6.78) 23.3 (10.40)
Probase Cold
5% 37.2 (1.75) 36.6 (2.80) 19.1 (3.74) 18.1 (2.90) 18.1 (4.59) 19.3 (3.50)
CHX % – chlorhexidine concentration; SD – standard deviation; IQR – interquartile range
Table 3. Descriptive statistics of the microtensile bond strength (µTBS) according to experimental group (n=6)
µTBS (MPa) Failure mode
MATERIAL CHX % Adhesive Mixed Cohesive
MEAN (SD) MEDIAN (IQR)
n (%) n (%) n (%)
0% 13.0 (3.74) 12.7 (5.88) 29 (96.7) 1 (3.3) 0 (0)
KOOLINER
2.5% 13.5 (3.64) 13.4 (6.01) 29 (96.7) 1 (3.3) 0 (0)
0% 22.6 (7.37) 22.2 (13.96) 19 (63.3) 5 (16.7) 6 (20.0)
UFI GEL HARD
5% 18.3 (5.58) 16.8 (9.56) 12 (40.0) 5 (16.7) 13 (43.3)
0% 45.0 (3.28) 44.0 (5.84) 27 (90.0) 2 (6.7) 1 (3.3)
PROBASE COLD
5% 33.7 (1.90) 33.1 (3.45) 27 (90.0) 3 (10.0) 0 (0)
CHX % – chlorhexidine concentration; SD – standard deviation; IQR – interquartile range