


Page 12 - SPEMD_60-3
P. 12
100                     rev port estomatol med dent cir maxilofac. 2019;60(3):96-103


            Table 2. Descriptive statistics for microtensile bond strength (µTBS) results (MPa).
                   Adhesive strategy          n         Mean ± SD        Min           Max          95% CI
                            Immediate        40         52.5 ± 13.56  a  22.17         89.78      [48.26; 56.71]
                SBU
                             4 years         35         26.0 ± 6.50  b   11.76         34.73      [23.27; 28.64]
                            Immediate        43         59.3 ± 12.39  a  32.37         80.59      [55.52; 62.97]
               SBU + HL
                             4 years         37         32.5 ± 5.72  b   12.33         39.16      [30.24; 34.67]
           Means with different superscript lower-case letters indicate statistically significant differences (p<0.05).
           Number of specimens (n), mean ± standard deviation (SD), minimum (Min) and maximum (Max) values, and lower/upper bound for mean at a
           95% confidence interval (CI).
           SBU, Scotchbond TM  Universal Adhesive; SBU + HL, Scotchbond TM  Universal Adhesive + hydrophobic layer.


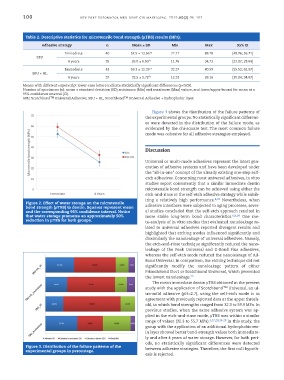
                                                                 Figure 3 shows the distribution of the failure patterns of
                                                              the experimental groups. No statistically significant differenc-
                                                              es were detected in the distribution of the failure mode, as
                                                              evidenced by the chi-square test. The most common failure
                                                              mode was cohesive for all adhesive strategies employed.


                                                              Discussion


                                                              Universal or multi-mode adhesives represent the latest gen-
                                                              eration of adhesive systems and have been developed under
                                                              the ‘‘all-in-one’’ concept of the already existing one-step self-
                                                              etch adhesives. Concerning most universal adhesives, in vitro
                                                              studies report consistently that a similar immediate dentin
                                                              microtensile bond strength can be achieved using either the
                                                              etch-and-rinse or the self-etch adhesive strategy while exhib-
                                                              iting a relatively high performance. 4,23  Nevertheless, when
            Figure 2. Effect of water storage on the microtensile
            bond strength (μTBS) to dentin. Squares represent mean   adhesive interfaces were subjected to aging processes, sever-
            and the corresponding 95% confidence interval. Notice   al studies concluded that the self-etch approach resulted in
            that water storage promotes an approximately 50%   more stable long-term bond characteristics. 6,9,24  One me-
            reduction in μTBS for both groups.                ta-analysis of in vitro studies that evaluated nanoleakage re-
                                                              lated to universal adhesives reported divergent results and
                                                              highlighted that etching modes influenced significantly and
                                                              dissimilarly the nanoleakage of universal adhesives. Namely,
                                                              the etch-and-rinse technique significantly reduced the nano-
                                                              leakage of the Peak Universal and G-Bond Plus adhesives,
                                                              whereas the self-etch mode reduced the nanoleakage of All-
                                                              Bond Universal. In comparison, the etching technique did not
                                                              significantly modify the nanoleakage pattern of either
                                                              Prime&Bond Elect or Scotchbond Universal, which presented
                                                              the lowest nanoleakage. 25
                                                                 The mean immediate dentin μTBS obtained in the present
                                                              study with the application of Scotchbond TM  Universal, an ul-
                                                              tra-mild adhesive (pH=2.7), using the self-etch mode is in
                                                              agreement with previously reported data at the upper thresh-
                                                              old, in which bond strengths ranged from 32.3 to 59.9 MPa. In
                                                              previous studies, when the same adhesive system was ap-
                                                              plied in the etch-and-rinse mode, μTBS was within a similar
                                                              range of values (32.3 to 55.7 MPa). 5,17,20,26-29  In this study, the
                                                              group with the application of an additional hydrophobic res-
                                                              in layer showed better bond-strength values both immediate-
                                                              ly and after 4 years of water storage. However, for both peri-
                                                              ods, no  statistically  significant differences were detected
            Figure 3. Distribution of the failure patterns of the   between adhesive strategies. Therefore, the first null hypoth-
            experimental groups in percentage.
                                                              esis is rejected.

