


Page 11 - SPEMD_60-3
P. 11
rev port estomatol med dent cir maxilofac . 2019;60(3):96-103            99


                                                                                                              ®
           in the x-axis direction, the free residual space between the   Statistical analysis was performed with IBM SPSS 23.0
           slices was filled with the light-body silicone Aquasil Ultra XLV   software (SPSS; Chicago, IL, USA). The normality of data was
           (Dentsply, DeTrey, Konstanz, Germany). For each tooth, the   assessed with the Kolmogorov-Smirnov test and visual inspec-
           tops of adjacent sticks were identified with two colors. Half of   tion of the histograms. Homoscedasticity was assessed with
           the peripheral and central sticks were used to measure mi-  Levene’s test. Since these two assumptions were not verified,
           crotensile bond strength (μTBS) after 7-day storage and the   the Kruskal-Wallis test was run to determine the effect of the
           others to determine μTBS after 4-year storage in water at 37ºC   adhesion strategy and aging on bond strength, followed by
           under the same protocol. During these 4 years, the medium   all-pairwise comparisons with Bonferroni corrections. The chi-
           was replaced every seven days to avoid contamination, follow-  square test was used to compare the distribution of failure
                                              22
           ing the ISO/TS 11405:2015 recommendations.  All sticks were   modes between groups. For all analyses, the significance level
           checked on an optical microscope (M300, Leica, Switzerland)   was set at α=0.05.
           at 40x magnification to exclude faulty specimens.
              Each stick was attached to a microtensile sample holder
           with cyanoacrylate adhesive (CE10Flex , Ce Chem Limited, Der-  Results
                                        ®
           byshire, UK) and then fixed on the microtensile device (Od04-
           Plus; Odeme Dental Research, Luzerna, Brazil). Specimens were   The overall mean μTBS, standard deviations, number of spec-
           fractured in tensile mode using a universal testing machine   imens (n) and multiple comparison statistical analyses of all
           (Model AG-I, Shimadzu Corporation, Kyoto, Japan) at a cross-  experimental groups are detailed in Table 2 and represented
           head speed of 0.5 mm/min. The maximum load was recorded   in Figure 2.
           in Newtons, and microtensile bond strength was calculated in   Data assessed with the Kolmogorov-Smirnov test failed to
           MPa according to the following equation: μTBS = F/A, where F   prove the normality of bond-strength values. The Kruskal-Wal-
           is the load at fracture (N) and A is the bonded area (mm ).   lis test determined that the distribution of bond-strength values
                                                          2
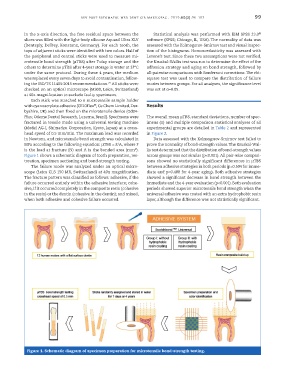
           Figure 1 shows a schematic diagram of tooth preparation, res-  across groups was not similar (p<0.001). All pair-wise compari-
           toration, specimen sectioning and bond-strength testing.  sons showed no statistically significant differences in μTBS
              The failure mode was analyzed under an optical micro-  between adhesive strategies in both periods (p=0.504 for imme-
           scope (Leica CLS 150 MR, Switzerland) at 40x magnification.   diate and p=0.408 for 4-year aging). Both adhesive strategies
           The fracture pattern was classified as follows: adhesive, if the   showed a significant decrease in bond strength between the
           failure occurred entirely within the adhesive interface; cohe-  immediate and the 4-year evaluation (p<0.001). Both evaluation
           sive, if it occurred completely in the composite resin (cohesive   periods showed superior microtensile bond strength when the
           in the resin) or the dentin (cohesive in the dentin); and mixed,   universal adhesive was coated with an extra hydrophobic resin
           when both adhesive and cohesive failure occurred.   layer, although the difference was not statistically significant.


            Figure 1. Schematic diagram of specimen preparation for microtensile bond-strength testing.

