
Page 15 - SPEMD_59-4
P. 15
rev port estomatol med dent cir maxilofac . 2018;59(4):181-190 187
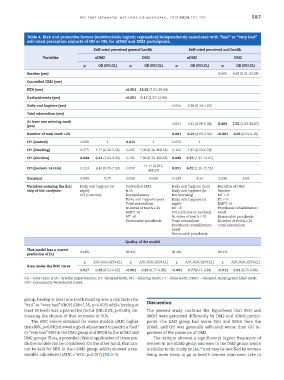
Table 4. Risk and protective factors (multivariable logistic regression) independently associated with “bad” or “very bad”
self-rated perception impacts of GH or OH, for nDM2 and DM2 participants.
Self-rated perceived general health Self-rated perceived oral health
Variables nDM2 DM2 nDM2 DM2
p OR (95%CL) p OR (95%CL) p OR (95%CL) p OR (95%CL)
Smoker (yes) 0.065 4.63 (0.91-23.54)
Controlled DM2 (yes)
HTA (yes) <0.001 16.62 (7.01-39.43)
Dyslipidaemia (yes) <0.001 5.17 (2.07-12.90)
Daily oral hygiene (yes) 0.056 0.38 (0.14-1.03)
Total edentulism (yes)
At least one missing tooth
(yes) 0.051 2.31 (0.99-5.38) 0.003 7.55 (2.03-28.07)
Number of total teeth ≥20 0.001 0.22 (0.09-0.56) <0.001 0.09 (0.04-0.18)
CPI (normal) 0.099 1 0.015 1 0.050 1
CPI (bleeding) 0.375 1.71 (0.52-5.56) 0.225 7.09 (0.30-168.54) 0.332 1.87 (0.53-6.59)
CPI (calculus) 0.044 3.21 (1.03-9.99) 0.192 7.98 (0.35-180.63) 0.049 3.55 (1.01-12.47)
21.11 (0.913-
CPI (pockets ≥4 mm) 0.123 2.43 (0.79-7.50) 0.057 0.025 4.32 (1.20-15.55)
488.37)
Constant 0.594 0.75 0.026 0.026 0.133 4.20 0.336 2.04
Variables entering the first Daily oral hygiene (at Controlled DM2 Daily oral hygiene (yes) Duration of DM2
step of the analyses: night) HTA Daily oral hygiene (in Smoker
CPI (calculus) Dyslipidaemia the morning) MT > 0
Daily oral hygiene (yes) Daily oral hygiene (at FT > 0
Total edentulism night) DMFT >0
Number of teeth ≥ 20 MT >0 Prosthesis rehabilitation
DMFT >0 CPI (calculus or pockets) need
MT >0 Number of teeth ≥ 20 Removable prosthesis
Removable prosthesis Total edentulism Number of teeth ≥ 20
Prosthesis rehabilitation Total edentulism
need
Removable prosthesis
Quality of the model
This model has a correct 64.8% 80.4% 81.0% 80.1%
prediction of (%)
p AUC ROC (95%CL) p AUC ROC (95%CL) p AUC ROC (95%CL) p AUC ROC (95%CL)
Area under the ROC curve
0.027 0.58 (0.51-0.65) <0.001 0.83 (0.77-0.88) <0.001 0.77(0.71-0.84) <0.011 0.81 (0.75-0.86)
OR – odds ratio; HTA – arterial hypertension; DT- decayed teeth; MT – missing teeth; FT – filled teeth; DMFT – decayed, missing and filled teeth;
CPI – Community Periodontal Index
group, having at least one tooth missing was a risk factor for Discussion
“bad” or “very bad” SROH (OR=7.55, p=0.003) while having at
least 20 teeth was a protective factor (OR=0.09, p<0.001), de- The present study confirms the hypothesis that SRH and
creasing the chance of that outcome in 91%. SROH were perceived differently by DM2 and nDM2 partici-
The AUC values obtained for some models (AUC higher pants. The DM2 group had worse SRH and SROH than the
than 80%, p<0.010) showed a good adjustment to predict a “bad” nDM2, and OH was generally self-rated worse than GH re-
or “very bad” SRH in the DM2 group and SROH in the nDM2 and gardless of the presence of DM2.
DM2 groups. Thus, a potential clinical application of these pre- The sample showed a significantly higher frequency of
dictive models can be considered. On the other hand, that can- women in the nDM2 group and men in the DM2 group, which
not be said for SRH in the nDM2 group, which showed a rea- is similar to the study by Liu, and may be justified by women
38
~
sonable adjustment (AUC = 65%, p=0.027) (Table 4). being more likely to go to health centres than men. Like in