Page 13 - SPEMD_59-4
P. 13

rev port estomatol med dent cir maxilofac . 2018;59(4):181-190         185


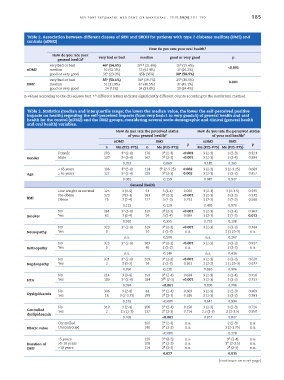
            Table 2. Association between different classes of SRH and SROH for patients with type 2 diabetes mellitus (DM2) and
            controls (nDM2)
                                                                How do you rate your oral health?
                       How do you rate your   very bad or bad  median   good or very good         p
                         general health?
                      very bad or bad       46  (34.6%)   27 a,b  (21.6%)  10  (15.4%)           <0.001
                                                                            b
                                              a
            nDM2      median                56 (42.1%)     53 (42.4%)      17 (26.2%)
                                                                            a
                      good or very good     31  (23.3%)    45b (36%)       38  (58.5%)
                                              b
                                                            b
                                                                            b
                                              a
                      very bad or bad       85  (53.1%)    30  (29.7%)     25  (30.5%)
            DM2       median                51 (31.9%)     47 (46.5%)      37 (45.1%)            0.001
                      good or very good      24 (15%)      24 (23.8%)      20 (24.4%)
           p-values according to the chi-square test.  a, b  different letters indicate significantly different counts according to the Bonferroni method.
            Table 3. Statistics (median and interquartile range; the lower the median value, the lower the self-perceived positive
            impacts on health) regarding the self-perceived impacts (from very bad=1 to very good=5) of general health and oral
            health for the control (nDM2) and the DM2 groups, considering several socio-demographic and clinical (general health
            and oral health) variables.
                                                  How do you rate the perceived status    How do you rate the perceived status
                                                       of your general health?            of your oral health?
                                                 nDM2             DM2                 nDM2       DM2
                                                                               p                           p
                                             n    Me (P25-P75)  n  Me (P25-P75)     Me (P25-P75) Me (P25-P75)
                                                     a
                                                                      b
                         Female              203    3  (2-4)  176    3  (2-3)  <0.001  3 (2-3)  3 (2-3)  0.321
                                                     a
                                                                      b
            Gender       Male                120    3  (3-4)  167    3  (2-3)  <0.001  3 (2-3)  3 (2-4)  0.894
                                                     0.353            0.869            0.182     0.365
                                                     a
                                                                     b
                         < 65 years          196    3  (3-4)  114   3  (2-3.25)  0.002  3 (2-3)  3 (2-3.25)  0.669
                                                     a
                                                                      b
            Age          ≥ 65 years          127    3  (2-4)  229    3  (2-3)  0.002  3 (2-3)   3 (2-3)  0.457
                                                     0.081            0.159            0.987     0.947
                                                        General Health
                         Low weight or normal  125  3 (3-4)   53     3 (2-4)  0.050   3 (2-3)   3 (2-3.5)  0.595
                                                                      b
                         Pre-obese           123    3 (3-4)   163    3  (2-3)  <0.001  3 (2-3)  3 (2-3)  0.532
                                                     a
            BMI          Obese               75     3 (2-4)   127    3 (2-3)  0.293   3 (2-3)   3 (2-3)  0.560
                                                     0.115            0.129            0.493     0.970
                                                                      b
                                                     a
                         No                  261    3  (3-4)  319    3  (2-3)  <0.001  3 (2-3)  3 (2-4)  0.963
            Smoker       Yes                 62     3 (2-4)   24     3 (2-4)  0.689   3 (2-3)   2 (1-3)  0.013
                                                     0.910            0.355            0.731     0.108
                                                     a
                                                                      b
                         No                  323    3  (2-4)  319    3  (2-3)  <0.001  3 (2-3)  3 (2-3)  0.764
            Neuropathy   Yes                 0                24     2 (1-3)   n.a.            2 (1.25-3)  n.a.
                                                     n.a.             0.504            n.a.      0.267
                                                                      b
                                                     a
                         No                  323    3  (2-4)  303    3  (2-3)  <0.001  3 (2-3)  3 (2-3)  0.917
            Retinopathy  Yes                 0                40     2 (1-2)   n.a.             2 (2-3)   n.a.
                                                     n.a.             0.148            n.a.      0.416
                                                     a
                                                                      b
                         No                  321    3  (2-4)  319    3  (2-3)  <0.001  3 (2-3)  3 (2-3)  0.620
            Nephropathy  Yes                 2      3 (3-3)   24     2 (1-3)  0.302   2 (2-2)  2 (1.25-3)  0.677
                                                     0.760            0.231            0.863     0.906
                         No                  214    3 (3-4)   159    3  (2-4)  0.638  3 (2-3)   3 (2-4)  0.758
                                                                      A
                                                     a
                                                                     Bb
            HTA          Yes                 109    3  (2-4)  184    2  (2-3)  <0.001  3 (2-3)  3 (2-3)  0.753
                                                     0.994           <0.001            0.898     0.706
                                                                      A
                         No                  306    3 (2-4)   44     3  (2-4)  0.369  3 (2-3)   3 (2-3)  0.969
            Dyslipidaemia  Yes               16    3 (2-3.75)  299   3  (2-3)  0.186  2 (2-3)   3 (2-3)  0.381
                                                                      B
                                                     0.532           <0.001            0.641     0.994
                         No                  319    3 (2-4)   206    3  (2-4)  0.150  3 (2-3)   3 (2-3)  0.726
                                                                      A
            Controlled   Yes                 2      2.5 (2-3)  137   2  (2-3)  0.714  2.5 (2-3)  2 (2-3.5)  0.950
                                                                      B
            dyslipidaemia
                                                     0.768           <0.001            0.857     0.847
                         Controlled                           103    2  (2-3)  n.a.             2 (2-3)   n.a.
                                                                      B
                                                                      A
            HbA1c value  Uncontrolled                         240    3  (2-3)  n.a.            3 (2-3.75)  n.a.
                                                                     <0.001                      0.178
                                                                      A
                                                                                                 A
                         ≤5 years                             120    3  (2-3)  n.a.             3  (2-4)  n.a.
                                                                      A
                                                                                                A
            Duration of   >5-10 years                         109    3  (2-3)  n.a.            3  (2-3.5)  n.a.
                                                                      B
                                                                                                 B
            DM2          >10 years                            114    2  (2-3)  n.a.             2  (2-3)  n.a.
                                                                     0.027                       0.015
                                                                                             (continues on next page)
   8   9   10   11   12   13   14   15   16   17   18