
Page 14 - SPEMD_59-4
P. 14
186 rev port estomatol med dent cir maxilofac. 2018;59(4):181-190
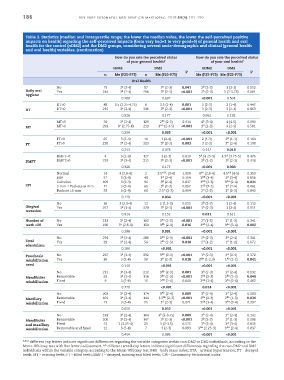
Table 3. Statistics (median and interquartile range; the lower the median value, the lower the self-perceived positive
impacts on health) regarding the self-perceived impacts (from very bad=1 to very good=5) of general health and oral
health for the control (nDM2) and the DM2 groups, considering several socio-demographic and clinical (general health
and oral health) variables. (continuation)
How do you rate the perceived status How do you rate the perceived status
of your general health? of your oral health?
nDM2 DM2 nDM2 DM2
p p
n Me (P25-P75) n Me (P25-P75) Me (P25-P75) Me (P25-P75)
Oral Health
a
No 79 3 (2-4) 87 3 (2-3) 0.041 2 (2-3) 3 (2-3) 0.052
b
B
Daily oral Yes 244 3 (2-4) 256 3 (2-3) <0.001 3 (2-3) 3 (2-3.75) 0.081
a
b
A
hygiene
0.708 0.697 <0.001 0.504
DT=0 88 3.5 (2.25-4.75) 6 3.5 (1-4) 0.001 3 (2-3) 2 (1-4) 0.447
a
b
DT DT>0 235 3 (2-4) 336 3 (2-3) <0.001 3 (2-3) 3 (2-3) 0.863
0.926 0.177 0.662 0.192
A
Bb
a
MT=0 30 3 (2-4) 129 2 (2-3) 0.314 4 (3-4) 4 (4-5) 0.090
B
Ab
a
MT MT>0 293 3 (2.75-4) 213 3 (2-3.5) <0.001 3 (2-3) 3 (2-3) 0.501
0.234 0.005 <0.001 <0.001
B
FT=0 85 3 (3-4) 18 3 (2-4) <0.001 2 (1-3) 2 (1-3) 0.184
A
a
b
FT FT>0 238 3 (2-4) 323 3 (2-3) 0.003 3 (2-3) 3 (2-4) 0.198
0.243 0.078 0.147 0.018
A
DMFT=0 4 3 (2-4) 127 3 (2-3) 0.610 5 (4.25-5) 4.5 (3.75-5) 0.476
A
b
B
B
a
DMFT DMFT>0 319 3 (3-4) 215 3 (2-3) <0.001 3 (2-3) 3 (2-3) 0.448
0.926 0.177 <0.001 0.003
AB
AB
Normal 14 4 (2.8-4) 2 3.5 ABC (3-0) 1.000 4 (2.8-4) 4.5 (4-5) 0.350
A
A
AB
BOP 57 3 (3-4) 49 3 (2-4) 0.154 3 (3-4) 3 (3-4) 0.856
Ab
B
Aa
Calculus 109 3 (2-4) 96 3 (2-4) 0.837 3 (2-3) 3 (2-4) 0.031
CPI 3 mm ≤ Pockets<6 mm 71 3 (3-4) 65 3 (2-3) 0.057 3 (2-3) 3 (2-4) 0.061
A
B
AB
C
B
B
Pockets ≥6 mm 39 3 (2-4) 60 2.5 (2-3) 0.064 2 (2-3) 2 (2-3) 0.843
0.129 0.034 <0.001 <0.001
B
No 36 3 (2.3-4) 12 2 (1.3-3) 0.055 2 (2-3) 3 (2-4) 0.112
Gingival Yes 257 3 (3-4) 270 3 (2-3) <0.001 3 (2-3) 3 (2-4) 0.551
b
A
a
recession
0.814 0.152 0.031 0.611
B
Bb
Number of No 133 3 (2-4) 192 3 (2-3) <0.001 2 (1-3) 2 (1-3) 0.341
a
B
Aa
Ab
Ab
a
teeth ≥20 Yes 190 3 (2.8-4) 150 3 (2-4) 0.016 3 (2-4) 3 (3-4) 0.002
0.208 0.001 <0.001 <0.001
a
A
A
No 294 3 (3-4) 288 3 (2-3) <0.001 3 (2-3) 3 (2-4) 0.341
Ab
Total Yes 29 3 (2-4) 54 2 (2-3) 0.010 2 (1-2) 1 (1-2) 0.072
a
Bb
B
B
edentulism
0.186 <0.001 <0.001 <0.001
a
Ab
A
A
Prosthesis No 297 3 (3-4) 292 3 (2-3) <0.001 3 (2-3) 3 (2-4) 0.372
Ba
Bb
B
rehabilitation Yes 26 3 (2-4) 50 2 (2-3) 0.018 2 (1-2.3) 1 (1-2) 0.041
need 0.140 <0.001 <0.001 <0.001
No 231 3 (3-4) 212 3 (2-3) 0.001 3 (2-3) 3 (2-4) 0.092
A
Ab
a
A
a
Bb
Bb
Ba
Mandibular Removable 83 3 (2-4) 116 3 (2-3) <0.001 2 (2-3) 2 (1-2) 0.040
Aa
Aa
AB
rehabilitation Fixed 9 3 (2-4) 15 2 (2-4) 0.640 3 (3-4) 3 (2-4) 0.482
0.770 <0.001 0.014 <0.001
A
a
Ab
No 203 3 (2-4) 174 3 (2-4) 0.009 3 (2-4) 3 (2-4) 0.083
A
Bb
Bb
a
Ba
Maxillary Removable 101 3 (2-4) 144 2.5 (2-3) <0.001 2 (2-3) 2 (1-3) 0.036
Aa
A
Aa
rehabilitation Fixed 19 3 (3-4) 25 3 (2-3) 0.071 3 (3-4) 3 (3-4) 0.397
0.650 0.012 <0.001 <0.001
A
A
b
a
No 193 3 (2-4) 164 3 (2-3.75) 0.009 3 (2-4) 3 (2-4) 0.142
a
B
B
b
Mandibular Removable 106 3 (2-4) 147 3 (2-3) <0.001 2 (2-3) 2 (1-3) 0.096
A
A
3 (3-4)
and maxillary Fixed 12 3 (2.25-4) 25 3 (2-3.5) 0.575 AB 3 (3-4) 0.835
AB
rehabilitation Removable and fixed 12 3 (3-4) 7 3 (2-3) 0.083 3 (2.25-3) 3 (2-4) 0.837
0.454 0.086 <0.001 <0.001
A,B,C different cap letters indicate significant differences regarding the variable categories within non-DM2 or DM2 individuals, according to the
Mann-Whitney test with Bonferroni adjustment. a,b different small-cap letters indicate significant differences regarding the non-DM2 and DM2
individuals within the variable category, according to the Mann-Whitney test. BMI – body mass index; HTA – arterial hypertension; DT – decayed
teeth; MT – missing teeth; FT – filled teeth; DMFT – decayed, missing and filled teeth; CPI – Community Periodontal Index