Page 12 - SPEMD_59-4
P. 12

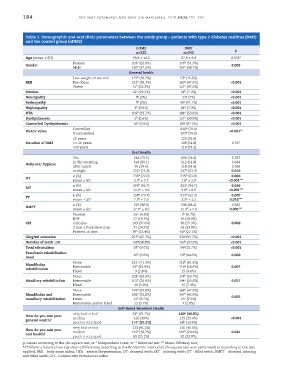
184                    rev port estomatol med dent cir maxilofac. 2018;59(4):181-190


            Table 1. Demographic and oral clinic parameters between the study group – patients with type 2 diabetes mellitus (DM2)
            and the control group (nDM2)
                                                          nDM2                DM2                  p
                                                          n=323               n=343
            Age (mean ± SD)                              59.8 ± 14.2         67.8 ± 9.8           0.533*
                                                                              b
                                                           a
                                Female                  203  (62.8%)        176  (51.3%)
            Gender                                         b                  a                   0.003
                                Male                    120  (37.2%)        167  (48.7%)
                                                       General health
                                                           a
                                                                              b
                                Low weight or normal    125  (38.7%)        53  (15.5%)
                                                           b
            BMI                 Pre-obese               123  (38.1%)        163  (47.5%)          <0.001
                                                                              a
                                                          b
                                                                              a
                                Obese                    75  (23.3%)        127  (37.0%)
                                                                              b
            Smoker                                       62  (19.2%)         24  (7.0%)           <0.001
                                                          a
                                                                               a
                                                           b
            Neuropathy                                    0  (0%)            24  (7%)             <0.001
                                                           b
                                                                              a
            Retinopathy                                   0  (0%)           40  (11.7%)           <0.001
                                                                              a
                                                          b
            Nephropathy                                  2  (0.6%)           24  (7.0%)           <0.001
                                                                              a
            HTA                                         109  (33.7%)        184  (53.6%)          <0.001
                                                           b
                                                          b
            Dyslipidaemia                                2  (0.6%)          137  (39.9%)          <0.001
                                                                              a
            Controlled Dyslipidaemia                     16  (5.0%)         299 (87.2%)           <0.001
                                                           b
                                Controlled                                   240  (70.0)
                                                                               a
            HbA1c value                                                                          <0.001**
                                Uncontrolled                                 103  (30.0)
                                                                               b
                                ≤5 years                                     120 (35.0)
            Duration of DM2     >5-10 years                                  109 (31.8)           0.767
                                >10 years                                    114 (33.2)
                                                        Oral Health
                                Yes                      244 (75.5)          256 (74.6)           0.787
                                in the morning           194 (60.1)          212 (61.8)           0.644
            Daily oral hygiene
                                after lunch              95 (29.4)           118 (34.4)           0.168
                                at night                 232  (71.8)         217  (63.3)          0.018
                                                           a
                                                                               b
                                                           a
                                                                               b
                                n (%)                    235  (72.8)         215  (62.9)          0.006
            DT
                                                                               a
                                mean ± SD                2.0  ± 2.7          2.8  ± 2.9          <0.001***
                                                           b
                                                           b
                                n (%)                    293  (90.7)         323  (94.7)          0.046
                                                                               a
            MT
                                                            a
                                                                               b
                                mean ± SD                13.0  ± 9.6         9.8  ± 8.9          <0.001***
                                                           a
                                n (%)                    238  (73.7)         213  (62.3)          0.002
                                                                               b
            FT
                                                                               a
                                                           b
                                mean ± SD                2.7  ± 2.9          3.3  ± 3.3          0.016***
                                n (%)                    319 (98.8)          336 (98.2)           0.585
            DMFT
                                                            a
                                                                               b
                                mean ± SD                17.7  ± 8.3         15.9  ± 7.8         0.005***
                                                           a
                                                                              b
                                Normal                   14  (4.8%)          2  (0.7%)
                                BOP                      57 (19.7%)          49 (18.0%)
            CPI                 Calculus                109 (37.6%)          96 (35.3%)           0.006
                                3 mm ≤ Pockets<6 mm      71 (24.5%)          65 (23.9%)
                                                          b
                                                                              a
                                Pockets ≥6 mm            39  (13.4%)        60  (22.1%)
            Gingival recession                          257  (87.7%)        270 (95.7%)           <0.001
                                                                               a
                                                           b
            Number of teeth ≥20                         190 (58.8%)         150  (43.9%)          <0.001
                                                           a
                                                                              b
            Total edentulism                             29  (9.0%)          54 (15.7%)           <0.001
                                                                              a
                                                           b
            Prosthesis rehabilitation                      b                  a
            need                                         26  (8.0%)         50  (14.6%)           0.008
                                                                              b
                                                           a
                                None                    231  (71.5%)        212  (61.8%)
            Mandibular          Removable                83  (22.9%)        116  (26.8%)          0.007
                                                          b
                                                                              a
            rehabilitation
                                Fixed                     9 (2.8%)           15 (4.4%)
                                                           a
                                                                              b
                                None                    203  (62.8%)        174  (50.7%)
                                                                              a
                                                           b
            Maxillary rehabilitation  Removable         101  (26.6%)        144  (35.6%)          0.027
                                Fixed                    19 (5.9%)           25 (7.3%)
                                None                    193  (59.8%)        164  (47.8%)
                                                                              b
                                                           a
            Mandibular and      Removable               106  (32.8%)        147  (42.9%)
                                                                              a
                                                           b
            maxillary rehabilitation  Fixed              12  (3.7%)          25  (7.3%)           0.003
                                                           b
                                                                              a
                                Removable and/or Fixed   12 (3.7%)            7 (2.0%)
                                                   Self-Rated Perceived Health
                                                                              a
                                                          b
                                very bad or bad          83  (25.7%)        140  (40.8%)
            How do you rate your
            general health?     median                   126 (39%)          135 (39.4%)           <0.001
                                                           a
                                                                              b
                                good or very good       114  (35.3%)        68  (19.8%)
                                very bad or bad         133 (41.2%)         160 (46.6%)
            How do you rate your                           a                  b
            oral health?        median                  125  (38.7%)        101  (29.4%)          0.041
                                good or very good        65 (20.1%)          82 (23.9%)
           p-values according to the chi-square test, or * Independent t-test, or ** Binomial test *** Mann-Whitney test;
           a,b  Different letters show significant differences according to the Bonferroni method (if chi-square test was performed) or according to the test
           applied. BMI – body mass index; HTA – arterial hypertension; DT- decayed teeth; MT – missing teeth; FT – filled teeth; DMFT – decayed, missing
           and filled teeth; CPI – Community Periodontal Index
   7   8   9   10   11   12   13   14   15   16   17