Page 38 - SPEMD_58-2
P. 38
94 rev port estomatol med dent cir maxilofac. 2017;58(2):91-96
stability on the Smartpeg screwed to the 2 mm healing abut-
Results
ment and to the 5 mm healing abutment (shown in the Table
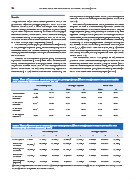
The global mean ISQ of the whole sample was 76.7 ± 5.5. The 1 as c-d).
global mean ISQ of the prototype group is 73.9 ± 5.3 and of the The mean ISQ values related to the position of the Osstell
standard one is 79.8 ± 3.7. When the sample were analyzed are given in Table 2. No statistically significant differences
without having into account which group the implants belong were found between the different measurements in the pro-
to, the mean ISQ values according to where the Smartpeg is totype implants group; independently of whether they were
screwed to were 76.2 ± 4.47 and 75.7 ± 4.72 when the Smartpeg registered directly to the implant or to the healing abutments.
was screwed directly to the implant; 78.2 ± 5.78, 77.3 ± 5.90, Nevertheless, in the standard implants group statistically sig-
76.0 ± 5.90 when the transducer was screwed to the abutments nificant differences (p < 0.05) were found between measuring
of 2, 3 and 5 mm of height respectively (Table 1). the stability on the Smartpeg screwed directly to the implant
The mean ISQ values by groups were also studied (Table 1). and screwed to the 2 mm healing abutments in all the posi-
In the prototype implants group, no statistically significant tions (1, 2, 3, 4) (shown in Table 2 as a-b, c-d, e-f, g- h) and be-
differences were found between measuring the stability on the tween the values registered without healing abutment and 3,5
Smartpeg screwed directly to the implant or screwed to differ- mm healing abutment, but only in positions 2 and 4 (shown in
ent abutments. Table 2 as b-f, b-h).
However, in the standard implants group statistically Data also showed that in both groups, all ISQ values of
significant differences (p < 0.05) were found between mea- positions 1 and 2 were statistically equal to each other but
suring the stability on the Smartpeg screwed directly to the statistically different from those of positions 3 and 4 (which
implant and screwed to the 2 and 3.5 mm healing abutments were also statistically equal to each other), except for the last
(shown in the Table 1 as a-b). Also, statistically significant situation in the standard group (without healing abutment) in
differences (p < 0.05) were found between measuring the which the 4 values were statistically equal (p < 0.05).
Table 1. Mean ISQ values and SD of the standard and prototype groups. (Means having different letter in the column
have statistically significance differences, p<0.05).
Standard Implants Prototype Implants Global Mean
Mean SD Mean SD Mean SD
In the implant 78.29 a ±2.78 73.97 ±4.83 76.15 ±4.47
In the 2mm 81.52 b,c ±3.73 74.94 ±5.63 78.23 ±5.78
abutment
In the 3,5mm b
abutment 80.52 ±3.94 74.12 ±5.84 77.32 ±5.90
In the 5mm d
abutment 79.18 ±3.78 72.88 ±6.01 76.03 ±5.90
In the implant 79.66 ±3.07 73.84 ±4.20 75.69 ±4.72
(repeated)
Table 2. Mean ISQ values and SD according to the Osstell position. (Means having different letter in the column have
statistically significance differences, p<0.05).
Standard Implants Prototype Implants
1 2 3 4 1 2 3 4
In the implant 77.27±3 a 77.27±3,9 c 79.33±2,5 e 79.30±2,4 g 72.87±5,1 72.70±5,3 75.33±4,5 75.10±4,9
In the 2mm b d f h
abutment 80.30±4,1 80.23±4,0 82.70±3,6 82.83±3,6 73.17±6,3 73.10±6,1 76.80±5,5 76.70±5,4
In the 3,5mm 79.30±4,3 b 79.33±4,4 81.67±3,7 f 81.77±3,7 h 72.43±6,5 72.37±6,3 75.93±5,3 75.73±5,8
abutment
In the 5mm 77.87±4,1 78.00±4,2 80.43±3,6 80.43±3,6 70.97±6,5 71.13±6,2 74.77±5,9 74.67±5,8
abutment
In the implant
(repeated) 78.93±3,3 79.07±3,4 80.21±3,0 80.43±2,9 72.27±4,4 72.57±4,7 75.27±4,0 75.27±4,1
(1) the ISQ is registered from the front of the rib; (2) the ISQ is registered from the back of the rib, (3) the ISQ is registered from the right of the
rib; and (4) the ISQ is registered from the left of the rib.