Page 19 - SPEMD_58-2
P. 19
rev port estomatol med dent cir maxilofac . 2017;58(2):71-78 75
Table 5. Adhesive Remnant Index (ARI)
ARI
no thermal cycling on thermal cycling
0 1 2 3 TOTAL 0 1 2 3 TOTAL
ED group 0 7 3 0 10 0 5 5 0 10
G group 0 2 6 1 9 0 1 8 0 9
TP group 0 1 7 0 8 0 0 9 0 9
0 means no adhesive left on tooth surface (0%).
1 means less than a half of adhesive left on tooth surface (<50%).
2 means more than a half of adhesive left on tooth surface (>50%).
3 means the entire adhesive left on tooth surface (100%).
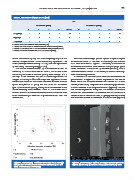
fect of the thermal cycling. On thermal cycling, only the dif- The shear bond strength plotted against the percentage of
ference between G and TP was statistically significant. The adhesive remnants on the teeth surface subjected to shear
t -test (Table 4) showed that only TP compomer was significant- bond tests is shown in Figure 1. Therefore, the amount of
ly affected by thermal cycling (p=0.013). adhesive remnants tend to increase for thermal cycled speci-
The failure mode exhibited by the adhesives scored as mens, relative to non -thermal cycled ones (Table 5). This is
according to the ARI is shown in Table 5. ARI scores noted more evidenced for G and ED adhesives, which exhibited high
discarding the effect of thermal cycling were mostly 1 and 2 shear bond strength values.
although those increased to 2 and 3 considering the effect of A cross -section overview of the tooth -adhesive -bracket re-
fatigue. According to Mann-Whitney Test, significant differ- gion is shown in Figure 2. A careful inspection of this site re-
ences were found on ARI values between the non -thermal vealed the lack of adhesion between the brackets and the ad-
cycled samples for ED group and the other two adhesives hesives, evidenced by the presence of interfacial gaps between
(p<0.05). On thermal cycling, the significant differences in ARI the two materials in all samples examined (Figure 3). This fact
values were only found between TP and ED. Some teeth bond- was further emphasized in Figure 4 that showed the fracture
ed with G and TP adhesives revealed fracture on enamel after surface with total absence of adhesive remnants bonded to the
shear bond strength tests and they were removed from ARI metallic mesh of the bracket base. ED group presented its frac-
assessment. ture interface between adhesive and enamel surface (Figure 5).
Figure 1. Relationship between the shear bond strength Figure 2. Cross section view of the tooth adhesive bracket
results and the amount of adhesive remaining on the region. A) Bracket; B) Bracket mesh; C) adhesive; D) tooth
teeth surface after debonding.