Page 18 - SPEMD_58-2
P. 18
74 rev port estomatol med dent cir maxilofac. 2017;58(2):71-78
by SEM on secondary (SE) and backscattered (BSE) electron two adhesives (p<0.05), followed by Mann -Whitney tests ai-
mode at magnification ranging from x100 up tp x2000 at 15 kV. ming at understanding which adhesives differed significantly.
The surfaces were previously coated with a gold film. The in-
spection of bracket bases after debonding was also produced.
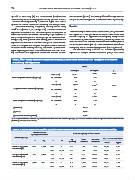
Data were statistically analyzed by two -way ANOVA using Results
®
SPSS v.21.0 (SPSS Inc., IL. Chicago, USA). The level of statistical
significance was set at 0.05. The two -way ANOVA was used to The bond strength results are shown in Table 3. Group G showed
determine differences between adhesive groups subjected or the highest bond strength results while the lowest values were
not on thermal fatigue and within groups for the same adhe- recorded for group ED, regardless thermal cycling. Groups G and
sive (p<0.05). Then post hoc tests were applied to evaluate the TP showed acceptable values for clinical practice. Signifcant dif-
significant differences in the bond strength of the adhesives. ferences were found between adhesives and between periods
T -test for independent samples was performed to discover for the same adhesive (p<0.05). The interaction adhesive/ther-
which adhesives were significantly influenced by thermal fa- mal cycling was not statistically signifcant (ANOVA, p=0.350).
tigue. Regarding ARI tests, Kruskal -Wallis test was used to ve- Post hoc tests Tukey HSD and LSD showed significantly
rify the existence of significant differences between at least higher bond strength results for G and TP groups, without ef-
Table 3. Mean values, standard deviation and statistical p values recorded on shear bond strength of the adhesives
to enamel by two way ANOVA
Shear
Adhesive
no fatigue on fatigue p
Mean (MPa) 11.16 a 10.02 a 0.355
Resin composite adhesive (G group) std. deviation 2.95 2.41
n 10 10
Mean (MPa) 8.41 bA 6.33 bB 0.013
Compomer based adhesive (TP group) std. deviation 2.06 1.15
n 9 10
Mean (MPa) 5.95 c 5.79 b 0.805
Resin composite adhesive (ED group) std. deviation 1.41 1.45
n 9 10
p (adhesive) <0.001
p (period) 0.038
p (interaction adhesive*period) 0.350
a,b,c different letters indicate signifcant differences between adhesive groups; A,B different letters indicate signifcant differences between
periods (for the same adhesive).
Table 4. T test for influence of thermal cycling on shear bond results recorded on orthodontic adhesives to enamel.
Levenes Test for t test for Equality of Mean values
Equality of Variances
Adhesive groups
Sig. Mean Std. Error 95% Confdence Interval
F Sig. t df
(2 tailed) Difference Difference Lower Upper
Resin composite 0.11 0.744 0.95 18 0.35 1.14 1.203 -1.38 3.67
adhesive (G)
0.95 17.29 0.35 1.14 1.203 -1.39 3.67
Compomer based 3.25 0.089 2.75 17 0.01 2.08 0.755 0.48 3.67
adhesive (TP)
2.67 12.29 0.02 2.082 0.777 0.39 3.77
Resin composite 0.001 0.15 0.25 17 0.8 0.165 0.658 -1.22 1.55
adhesive (ED)
0.25 16.89 0.8 0.165 0.657 -1.22 1.55