


Page 33 - SPEMD_62-3
P. 33
rev port estomatol med dent cir maxilofac . 2021;62(3):157-162         159


           ried out in the municipality of Campina Grande, Paraíba, Brazil.   Data were analyzed using the IBM SPSS software, version
           This municipality has a Human Development Index (HDI) of   22.0 for Windows (IBM Corp., Armonk, NY, USA). Descriptive
           0.72, a Gini coefficient of 0.58, and about 407,500 inhabitants. 16  statistical analysis corresponded to calculating absolute and
              The present study’s sample was selected from a previous   relative frequencies for categorical variables and measuring
               17
           study  that had a probabilistic sample of 466 schoolchildren,   central tendency and variability for quantitative variables. The
           regularly enrolled in elementary schools in the municipality,   Kolmogorov -Smirnov test was used to verify the normality of
           who had all first permanent molars fully erupted in the oral   quantitative  variables.  As  data  distribution  was  non-
           cavity and had no mental retardation, developmental disorders,   -parametric, the Mann -Whitney and Kruskal -Wallis U tests
           neuropsychiatric disorders, and no fixed orthodontic appliance.   were adopted. The significance level adopted was 5%.
           Our sample was comprised of 185 children aged 8 -10 years of   This study was approved by the local Human Research Ethics
           both sexes, who had a minimum score of 32 on the Children’s   Committee, under number 3.155.847. Informed consent was ob-
           Fear Survey Schedule -Dental Subscale questionnaire (CFSS -DS).  tained from all guardians and individuals included in the study.
              Data were collected between March and May 2019 in a
           school environment. First, the research was presented to the
           children, who received informed consent forms to hand over   Results
           to their parents or guardians. On the second visit, with the
           parents’ authorization, children were transferred to a reserved   The sample’s mean age was 8.95 ± 0.8 years. Most participants
           room to understand the research and assent. Finally, the CFSS-  were female (59.5%) aged 9 years (37.3%), followed by
           -DS questionnaire was applied in the presence of three re-  8 -year -olds (34.1%) and 10 -year -olds (28.6%).
           searchers to guide the self -completion by the schoolchildren.   The average total CFSS -DS score was 40.44 ± 6.81, with a me-
           Children had the opportunity to ask questions about the ques-  dian of 40.00, IIQ  35–45, a minimum score of 32, and a maxi-
                                                                           25 -75
           tionnaire and, when necessary, obtain support by reading the   mum score of 75. According to the CFSS -DS, most children had
           questions. Researchers did not influence the children’s re-  high dental fear (53.5%), and 46.5% had moderate dental fear.
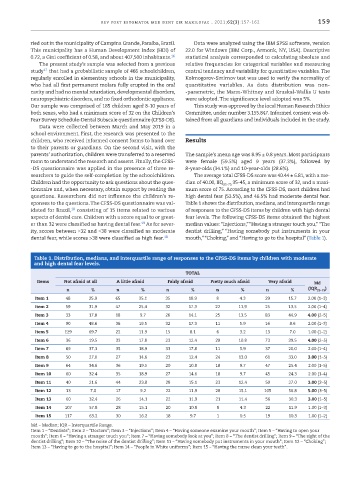
           sponses to the questions. The CFSS -DS questionnaire was val-  Table 1 shows the distribution, medians, and interquartile range
                         18
           idated for Brazil,  consisting of 15 items related to various   of responses to the CFSS -DS items by children with high dental
           aspects of dental care. Children with a score equal to or great-  fear levels. The following CFSS -DS items obtained the highest
                                                19
           er than 32 were classified as having dental fear.  As for sever-  median values: “Injections,” “Having a stranger touch you,” “The
           ity, scores between ≥32 and ≤38 were classified as moderate   dentist drilling,” “Having somebody put instruments in your
           dental fear, while scores >38 were classified as high fear. 18  mouth,” “Choking,” and “Having to go to the hospital” (Table 1).


            Table 1. Distribution, medians, and interquartile range of responses to the CFSS ‑DS items by children with moderate
            and high dental fear levels.
                                                               TOTAL
             Items    Not afraid at all  A little afraid  Fairly afraid  Pretty much afraid  Very afraid  Md
                       n       %        n       %       n       %        n       %       n       %     (IQR 25 ‑75 )
             Item 1    48      25.9    65      35.1     35      18.9     8       4.3     29      15.7  2.00 (1–3)
             Item 2    59      31.9    47      25.4     32      17.3    22      11.9     25      13.5  2.00 (1–4)
             Item 3    33      17.8    18      9.7      26      14.1    25      13.5     83      44.9  4.00 (2–5)
             Item 4    90      48.6    36      19.5     32      17.3    11       5.9     16      8.6   2.00 (1–3)
             Item 5   129      69.7    22      11.9     15      8.1      6       3.2     13      7.0   1.00 (1–2)
             Item 6    36      19.5    33      17.8     23      12.4    20      10.8     73      39.5  4.00 (2–5)
             Item 7    69      37.3    35      18.9     33      17.8    11       5.9     37      20.0  2.00 (1–4)
             Item 8    50      27.0    27      14.6     23      12.4    24      13.0     61      33.0  3.00 (1–5)
             Item 9    64      34.6    36      19.5     20      10.8     18      9.7     47      25.4  2.00 (1–5)
             Item 10   60      32.4    35      18.9     27      14.6     18      9.7     45      24.3  2.00 (1–4)
             Item 11   40      21.6    44      23.8     28      15.1     23     12.4     50      27.0  3.00 (2–5)
             Item 12   13      7.0     17       9.2     22      11.9     28     15.1     105     56.8  5.00 (3–5)
             Item 13   60      32.4    26      14.1     22      11.9     21     11.4     56      30.3  3.00 (1–5)
             Item 14   107     57.8    28      15.1     20      10.8     8       4.3     22      11.9  1.00 (1–3)
             Item 15   117     63.2    30      16.2     18      9.7      1       0.5     19      10.3  1.00 (1–2)
           Md – Median; IQR – Interquartile Range.
           Item 1 – “Dentists”; Item 2 – “Doctors”; Item 3 – “Injections”; Item 4 – “Having someone examine your mouth”; Item 5 – “Having to open your
           mouth”; Item 6 – “Having a stranger touch you”; Item 7 – “Having somebody look at you”; Item 8 – “The dentist drilling”; Item 9 – “The sight of the
           dentist drilling”; Item 10 – “The noise of the dentist drilling”; Item 11 – “Having somebody put instruments in your mouth”; Item 12 – “Choking”;
           Item 13 – “Having to go to the hospital”; Item 14 – “People in White uniforms”; Item 15 – “Having the nurse clean your teeth”.

