
Page 32 - SPEMD_62-1
P. 32
26 rev port estomatol med dent cir maxilofac. 2021;62(1):23-28
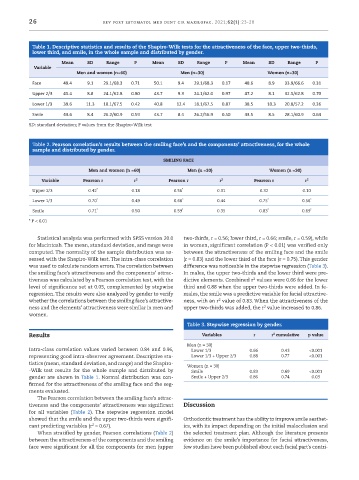
Table 1. Descriptive statistics and results of the Shapiro -Wilk tests for the attractiveness of the face, upper two -thirds,
lower third, and smile, in the whole sample and distributed by gender.
Mean SD Range P Mean SD Range P Mean SD Range P
Variable
Men and women (n=60) Men (n=30) Women (n=30)
Face 49.4 9.1 29.1/68.3 0.71 50.1 9.4 29.1/68.3 0.17 48.6 8.9 33.9/66.6 0.31
Upper 2/3 45.4 8.8 24.1/62.8 0.80 43.7 9.3 24.1/62.0 0.97 47.2 8.1 32.5/62.8 0.70
Lower 1/3 39.6 11.3 18.1/67.5 0.42 40.8 12.4 18.1/67.5 0.87 38.5 10.3 20.8/57.2 0.36
Smile 43.6 8.4 26.2/60.9 0.59 43.7 8.4 26.2/56.9 0.50 43.5 8.5 28.1/60.9 0.64
SD: standard deviation; P values from the Shapiro -Wilk test
Table 2. Pearson correlation’s results between the smiling face’s and the components’ attractiveness, for the whole
sample and distributed by gender.
SMILING FACE
Men and women (n =60) Men (n =30) Women (n =30)
Variable Pearson r r 2 Pearson r r 2 Pearson r r 2
Upper 2/3 0.42 * 0.18 0.56 * 0.31 0.32 0.10
Lower 1/3 0.70 * 0.49 0.66 * 0.44 0.75 * 0.56 *
Smile 0.71 * 0.50 0.59 * 0.35 0.83 * 0.69 *
* P < 0.01
Statistical analysis was performed with SPSS version 20.0 two -thirds, r = 0.56; lower third, r = 0.66; smile, r = 0.59), while
for Macintosh. The mean, standard deviation, and range were in women, significant correlation (P < 0.01) was verified only
computed. The normality of the sample distribution was as- between the attractiveness of the smiling face and the smile
sessed with the Shapiro -Wilk test. The intra -class correlation (r = 0.83) and the lower third of the face (r = 0.75). This gender
was used to calculate random errors. The correlation between difference was noticeable in the stepwise regression (Table 3).
the smiling face’s attractiveness and the components’ attrac- In males, the upper two -thirds and the lower third were pre-
tiveness was calculated by a Pearson correlation test, with the dictive elements. Combined r values were 0.66 for the lower
2
level of significance set at 0.05, complemented by stepwise third and 0.88 when the upper two -thirds were added. In fe-
regression. The results were also analyzed by gender to verify males, the smile was a predictive variable for facial attractive-
2
whether the correlations between the smiling face’s attractive- ness, with an r value of 0.83. When the attractiveness of the
ness and the elements’ attractiveness were similar in men and upper two -thirds was added, the r value increased to 0.86.
2
women.
Table 3. Stepwise regression by gender.
Results Variables r r cumulative p value
2
Men (n = 30)
Intra -class correlation values varied between 0.84 and 0.96, Lower 1/3 0.66 0.43 <0.001
representing good intra -observer agreement. Descriptive sta- Lower 1/3 + Upper 2/3 0.88 0.77 <0.001
tistics (mean, standard deviation, and range) and the Shapiro-
Women (n = 30)
-Wilk test results for the whole sample and distributed by Smile 0.83 0.69 <0.001
gender are shown in Table 1. Normal distribution was con- Smile + Upper 2/3 0.86 0.74 0.03
firmed for the attractiveness of the smiling face and the seg-
ments evaluated.
The Pearson correlation between the smiling face’s attrac-
tiveness and the components’ attractiveness was significant Discussion
for all variables (Table 2). The stepwise regression model
showed that the smile and the upper two -thirds were signifi- Orthodontic treatment has the ability to improve smile aesthet-
2
cant predicting variables (r = 0.67). ics, with its impact depending on the initial malocclusion and
When stratified by gender, Pearson correlations (Table 2) the selected treatment plan. Although the literature presents
between the attractiveness of the components and the smiling evidence on the smile’s importance for facial attractiveness,
face were significant for all the components for men (upper few studies have been published about each facial part’s contri-