
Page 25 - SPEMD_62-1
P. 25
rev port estomatol med dent cir maxilofac . 2021;62(1):16-22 19
bracket base; Index 2 – mixed failure, with 0–50% of remaining
adhesive on the bracket base; Index 3 – 0% of adhesive remain-
ing on the bracket base, corresponding to bracket -adhesive
interface failure. The presence of cohesive substrate failure
(Yes / No) was also evaluated.
Statistical analysis was performed using Statview software
(Abacus Concepts Inc., Berkeley, California, USA). The Shapiro-
-Wilk test was used to assess normality in distribution, and
the Levene test for homogeneity of variance. The adhesive
strength values obtained in the experimental groups were
evaluated by a two -way analysis of variance (ANOVA), using
the surface treatment and the adhesive system as indepen-
dent variables. Comparisons between groups were performed
with post -hoc tests by the Student -Newman -Keuls method.
The control group and the experimental groups were com-
pared with a one -way ANOVA, using the combination surface
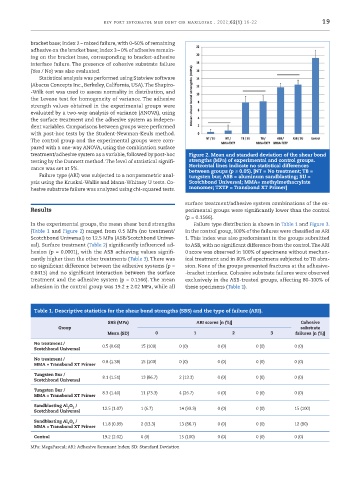
treatment/adhesive system as a variable, followed by post -hoc Figure 2. Mean and standard deviation of the shear bond
testing by the Dunnett method. The level of statistical signifi- strengths (MPa) of experimental and control groups.
cance was set at 5%. Horizontal lines indicate no statistical differences
between groups (p ≥ 0.05). [NT = No treatment; TB =
Failure type (ARI) was subjected to a nonparametric anal- tungsten bur; ASB = aluminum sandblasting; SU =
ysis using the Kruskal -Wallis and Mann -Whitney U tests. Co- Scotchbond Universal; MMA= methylmethacrylate
hesive substrate failure was analyzed using chi -squared tests. monomer; TXTP = Transbond XT Primer]
surface treatment/adhesive system combinations of the ex-
Results perimental groups were significantly lower than the control
(p = 0.1566).
In the experimental groups, the mean shear bond strengths Failure type distribution is shown in Table 1 and Figure 3.
(Table 1 and Figure 2) ranged from 0.5 MPa (no treatment/ In the control group, 100% of the failures were classified as ARI
Scotchbond Universal) to 12.5 MPa (ASB/Scotchbond Univer- 1. This index was also predominant in the groups submitted
sal). Surface treatment (Table 2) significantly influenced ad- to ASB, with no significant difference from the control. The ARI
hesion (p = 0.0001), with the ASB achieving values signifi- 0 score was observed in 100% of specimens without mechan-
cantly higher than the other treatments (Table 3). There was ical treatment and in 80% of specimens subjected to TB abra-
no significant difference between the adhesive systems (p = sion. None of the groups presented fractures at the adhesive-
0.8415) and no significant interaction between the surface -bracket interface. Cohesive substrate failures were observed
treatment and the adhesive system (p = 0.1566). The mean exclusively in the ASB -treated groups, affecting 80–100% of
adhesion in the control group was 19.2 ± 2.02 MPa, while all these specimens (Table 1).
Table 1. Descriptive statistics for the shear bond strengths (SBS) and the type of failure (ARI).
SBS (MPa) ARI scores [n (%)] Cohesive
Group substrate
Mean (SD) 0 1 2 3 failures [n (%)]
No treatment /
Scotchbond Universal 0.5 (0.66) 15 (100) 0 (0) 0 (0) 0 (0) 0 (0)
No treatment / 0.8 (1.38) 15 (100) 0 (0) 0 (0) 0 (0) 0 (0)
MMA + Transbond XT Primer
Tungsten Bur / 8.1 (1.51) 13 (86.7) 2 (13.3) 0 (0) 0 (0) 0 (0)
Scotchbond Universal
Tungsten Bur /
MMA + Transbond XT Primer 8.3 (1.40) 11 (73.3) 4 (26.7) 0 (0) 0 (0) 0 (0)
Sandblasting Al O /
3
2
Scotchbond Universal 12.5 (1.07) 1 (6.7) 14 (93.3) 0 (0) 0 (0) 15 (100)
Sandblasting Al O / 11.8 (0.99) 2 (13.3) 13 (86.7) 0 (0) 0 (0) 12 (80)
2
3
MMA + Transbond XT Primer
Control 19.2 (2.02) 0 (0) 15 (100) 0 (0) 0 (0) 0 (0)
MPa: MegaPascal; ARI: Adhesive Remnant Index; SD: Standard Deviation