
Page 19 - SPEMD_62-1
P. 19
rev port estomatol med dent cir maxilofac . 2021;62(1):9-15 13
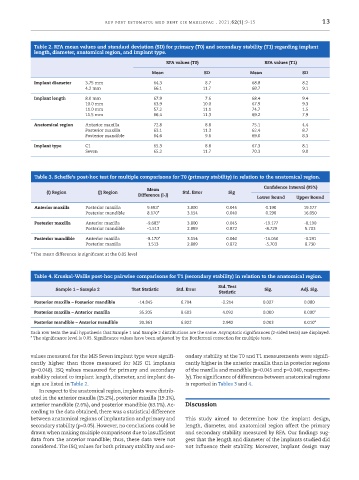
Table 2. RFA mean values and standard deviation (SD) for primary (T0) and secondary stability (T1) regarding implant
length, diameter, anatomical region, and implant type.
RFA values (T0) RFA values (T1)
Mean SD Mean SD
Implant diameter 3.75 mm 64.3 8.7 68.8 8.2
4.2 mm 66.1 11.7 68.7 9.1
Implant length 8.0 mm 67.9 7.6 68.4 9.4
10.0 mm 63.9 10.0 67.9 9.3
11.0 mm 57.2 11.1 74.7 1.5
11.5 mm 66.4 11.3 69.2 7.9
Anatomical region Anterior maxilla 72.8 8.8 75.1 4.4
Posterior maxilla 63.1 11.3 62.4 8.7
Posterior mandible 64.6 9.6 69.0 8.3
Implant type C1 65.3 8.8 67.3 8.1
Seven 65.2 11.7 70.3 9.0
Table 3. Scheffe’s post -hoc test for multiple comparisons for T0 (primary stability) in relation to the anatomical region.
Confidence Interval (95%)
Mean
(I) Region (J) Region Std. Error Sig
Difference (I -J)
Lower Bound Upper Bound
Anterior maxilla Posterior maxilla 9.683* 3.800 0.045 0.190 19.177
Posterior mandible 8.170* 3.154 0.040 0.290 16.050
Posterior maxilla Anterior maxilla -9.683* 3.800 0.045 -19.177 -0.190
Posterior mandible -1.513 2.889 0.872 -8.729 5.703
Posterior mandible Anterior maxilla -8.170* 3.154 0.040 -16.050 -0.291
Posterior maxilla 1.513 2.889 0.872 -5.703 8.730
* The mean difference is significant at the 0.05 level
Table 4. Kruskal -Wallis post -hoc pairwise comparisons for T1 (secondary stability) in relation to the anatomical region.
Std. Test
Sample 1 – Sample 2 Test Statistic Std. Error Sig. Adj. Sig.
Statistic
Posterior maxilla – Posterior mandible -14.845 6.704 -2.214 0.027 0.080
Posterior maxilla – Anterior maxilla 35.205 8.603 4.092 0.000 0.000*
Posterior mandible – Anterior mandible 20.361 6.922 2.942 0.003 0.010*
Each row tests the null hypothesis that Sample 1 and Sample 2 distributions are the same. Asymptotic significances (2 -sided tests) are displayed.
* The significance level is 0.05. Significance values have been adjusted by the Bonferroni correction for multiple tests.
values measured for the MIS Seven implant type were signifi- ondary stability at the T0 and T1 measurements were signifi-
cantly higher than those measured for MIS C1 implants cantly higher in the anterior maxilla than in posterior regions
(p=0.048). ISQ values measured for primary and secondary of the maxilla and mandible (p=0.045 and p=0.040, respective-
stability related to implant length, diameter, and implant de- ly). The significance of differences between anatomical regions
sign are listed in Table 2. is reported in Tables 3 and 4.
In respect to the anatomical region, implants were distrib-
uted in the anterior maxilla (15.2%), posterior maxilla (19.1%),
anterior mandible (2.6%), and posterior mandible (63.1%). Ac- Discussion
cording to the data obtained, there was a statistical difference
between anatomical regions of implantation and primary and This study aimed to determine how the implant design,
secondary stability (p<0.05). However, no conclusions could be length, diameter, and anatomical region affect the primary
drawn when making multiple comparisons due to insufficient and secondary stability measured by RFA. Our findings sug-
data from the anterior mandible; thus, these data were not gest that the length and diameter of the implants studied did
considered. The ISQ values for both primary stability and sec- not influence their stability. Moreover, implant design may