
Page 18 - SPEMD_62-1
P. 18
12 rev port estomatol med dent cir maxilofac. 2021;62(1):9-15
Table 1. Implant dimensions and anatomical region for the two groups.
C1 Implants (n=40) Seven Implants (n=39)
Cases (n) Cases (%) Cases (n) Cases (%)
Implant diameter 3.75 mm 19 47.5 20 51.3
4.2 mm 21 52.5 19 48.7
Implant length 8.0 mm 11 27.5 1 2.6
10.0 mm 14 35.0 19 48.7
11.0 mm 2 5.0 2 5.1
11.5 mm 13 32.5 17 43.6
Anatomic region Anterior maxilla 5 12.5 7 17.9
Posterior maxilla 5 12.5 10 25.6
Anterior mandible 1 2.5 1 2.6
Posterior mandible 29 72.5 21 53.8
tegration failure, reaching an overall implant survival rate of the implants’ diameter and the ISQ values for secondary sta-
96.2%. The anatomical region for implantation, implant types, bility (p=0.930). However, different results were obtained when
and implant dimensions are listed in Table 1. considering the implant design. The secondary stability ISQ
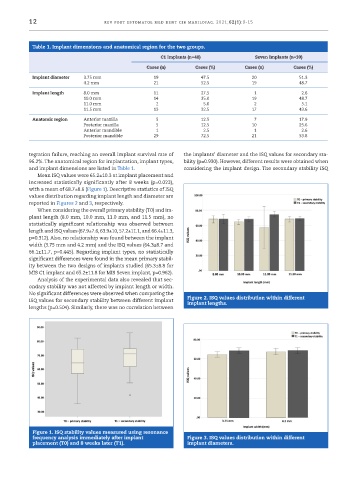
Mean ISQ values were 65.2±10.3 at implant placement and
increased statistically significantly after 8 weeks (p=0.023),
with a mean of 68.7±8.6 (Figure 1). Descriptive statistics of ISQ
values distribution regarding implant length and diameter are
reported in Figures 2 and 3, respectively.
When considering the overall primary stability (T0) and im-
plant length (8.0 mm, 10.0 mm, 11.0 mm, and 11.5 mm), no
statistically significant relationship was observed between
length and ISQ values (67.9±7.6, 63.9±10, 57.2±11.1, and 66.4±11.3,
p=0.312). Also, no relationship was found between the implant
width (3.75 mm and 4.2 mm) and the ISQ values (64.3±8.7 and
66.1±11.7, p=0.445). Regarding implant types, no statistically
significant differences were found in the mean primary stabil-
ity between the two designs of implants studied (65.3±8.8 for
MIS C1 implant and 65.2±11.8 for MIS Seven implant, p=0.962).
Analysis of the experimental data also revealed that sec-
ondary stability was not affected by implant length or width.
No significant differences were observed when comparing the
ISQ values for secondary stability between different implant Figure 2. ISQ values distribution within different
implant lengths.
lengths (p=0.504). Similarly, there was no correlation between
Figure 1. ISQ stability values measured using resonance
frequency analysis immediately after implant Figure 3. ISQ values distribution within different
placement (T0) and 8 weeks later (T1). implant diameters.