


Page 39 - SPEMD_60-3
P. 39
rev port estomatol med dent cir maxilofac . 2019;60(3):125-129         127


                                                                          ®
           mar test, the minimum estimated sample was 38 individuals.   America, Inc. , USA), according to the manufacturer’s in-
           For the  Wilcoxon test, initially, a sample calculation for a   structions. Oral odor was classified into five levels: (0) none;
           t-test for paired samples was carried out, and a minimum   (1) slight; (2) moderate; (3) heavy; (4) strong; and (5) intense.
           sample of five individuals was estimated. Subsequently, a 15%   A wooden spatula was used to assess tongue coating.
           increase was applied as an adjustment for the use of non-par-  Tongue coating was scored from 0 to 3, as follows: 0 if there
           ametric testing. Thus, the minimum sample size estimated   was no tongue coating, 1 if it covered less than one-third of
           for the application of the Wilcoxon test was six individuals.   the tongue’s dorsum, 2 if it covered one- to two-thirds of
           The sample calculations were performed using BioEstat (ver-  the tongue’s dorsum; and 3 if it covered more than two-
           sion 5.3, Brazil).                                  thirds of the tongue’s dorsum. All participants were clini-
              A cross-sectional longitudinal study was conducted on   cally evaluated at the same time of day, and the rate re-
           40 orthodontics patients. Before data collection, the project   sponse was 100%.
           was approved by the Research Ethics Committee of South-  Data normality was evaluated using the Shapiro-Wilk test
           west Bahia State University (number 024-009). The patients   for the quantitative variables. The difference between before
           and their caregivers gave informed written consent after   and after the education intervention was assessed by the Mc-
           being explained the study in detail. The participants were 14   Nemar test, the kappa statistic for the categorical variables,
           to 18 years old and were receiving fixed orthodontic treat-  and the Wilcoxon test for the quantitative variable. Signifi-
           ment in a private dentistry clinic. Data collection was con-  cance was determined at a 5% (α=0.05) confidence level. The
           ducted during regular orthodontic check-ups and included   data were tabulated and analyzed using the IBM SPSS statis-
           an interview and a clinical evaluation, which were repeated   tical software version 21.0 for Windows (2012, IBM Corp., Ar-
           27 days after the implementation of the oral-health educa-  monk, NY).
           tion program.
              The inclusion criteria of the study were: (1) dental and
           skeleton Angle Class I malocclusion; (2) complete permanent   Results
           dentition; (3) no decay; (4) age between 14 and 18 years old;
           (5) not presenting anteroinferior crowding higher than 4 mm;   The  analysis  included  40  patients  under  fixed  orthodontic
           and (6) use of conventional fixed orthodontics for 6 to 24   treatment for a period of 6 to 24 months (11.8 ± 3.8 months).
           months. The exclusion criteria were the following: 1) pres-  The participants were between 14 and 18 years old (15.5 ± 1.26
           ence of gastric disorders; 2) infections in the respiratory   years), and 20 were male and 20 female. A total of 38 (95%) of
           tract; 3) anatomical pathologies in the hard or soft oral tis-  the patients were students, whereas 5% (2) reported other oc-
           sues; 4) any motor deficiency that interfered with perform-  cupations (work or trainee).
           ing oral practices; 5) presence of metabolic diseases; 6) pres-  At the baseline, most of the participants (80%) reported
           ence of systemic  diseases; 7) use  of  medicines; 8) use of   gingival bleeding; however, after 27 days of implementation of
           mouthwash; and 9) smoking.                          the oral education program, no participant had that symptom
              The subjects were under fixed orthodontic therapy (Morel-  (Table 1). Analysis of the questions concerning oral hygiene
           li, Sorocaba, Brazil) in both dental arches, with adapted ortho-  practices and oral odor perception by others indicated low ad-
           dontic rings on the molars, conventional metal brackets bond-  herence  between baseline and 27 days after the implementa-
           ed to the vestibular teeth surfaces and individual elastic   tion of the education program (Table 2).
           ligatures. The metallic rings were bonded with glass-ionomer   The oral hygiene program impacted the halitosis self-per-
                               ®
           dental cement (Vidrion C , SSWhite, Juíz de Fora, Brazil). All   ception, oral odor measurement and tongue coating (Table 3).
           excess cement was removed.                          The results highlighted that, after 27 days from the interven-
              All interviews were conducted by the same clinic, who   tion, the fixed-orthodontic patients exhibited a 62% median
           determined demographic data, frequency of oral hygiene   increase in the self-perceived oral odor score, and a 75% and
           practices, complaints of gingival bleeding, perception of hal-  100% reduction in oral malodor and tongue-coating scores,
           itosis symptoms when meeting a person for the first time,   respectively.
           and self-perception of oral odor, as evaluated on a visual
           scale from 0 to 100, where 100 represented very good oral
           odor. A previously calibrated examiner collected all the data.
           The overall percentage of agreement was 98.16%, and the
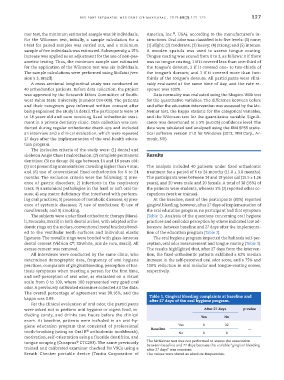
           kappa was 0.89.                                      Table 1. Gingival bleeding complaints at baseline and
                                                                after 27 days of the oral hygiene program.
              For the clinical evaluation of oral odor, the participants
           were asked not to perform oral hygiene or ingest food, in-                  After 27 days   p-value
           cluding candy, and drinks two hours before the clinical                   Yes       No
           exam. At baseline, patients were included in an oral-hy-
           giene education program that consisted of professional   Baseline  Yes     0        32        —
                                     ®
           tooth-brushing (using an Oral B  orthodontic toothbrush),        No        0         8
           motivation, self-orientation using a fluoride dentifrice, and
                                 ®
           tongue scraping (Curaprox CTC203). The same previously   The McNemar test was not performed to assess the association
                                                               between baseline and 27 days because the variable “gingival bleeding
           trained and calibrated examiner checked for VSCs using a   after 27 days” was constant.
           Breath Checker portable device (Tanita Corporation of   The values were stated as absolute frequencies.

