


Page 34 - SPEMD_60-3
P. 34
122                    rev port estomatol med dent cir maxilofac. 2019;60(3):118-124


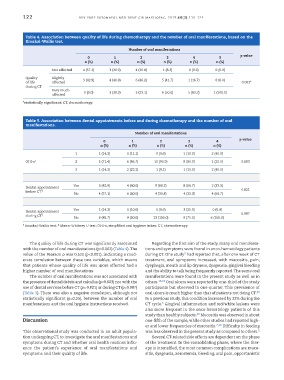
            Table 4. Association between quality of life during chemotherapy and the number of oral manifestations, based on the
            Kruskal-Wallis test.
                                                       Number of oral manifestations
                                                                                                      p value
                                      0          1          2          3          4          5
                                     n (%)      n (%)      n (%)      n (%)      n (%)      n (%)
                       Not affected  4 (57.1)  3 (30.0)   4 (30.8)   1 (8.3)    0 (0.0)    0 (0.0)
            Quality    Slightly
            of life    affected     3 (42.9)   4 (40.0)   6 (46.2)   5 (41.7)   1 (16.7)   0 (0.0)    0.002*
            during CT
                       Very much    0 (0.0)    3 (30.0)   3 (23.1)   6 (50.0)   5 (83.3)   1 (100.0)
                       affected
           *statistically significant; CT, chemotherapy.


            Table 5. Association between dental appointments before and during chemotherapy and the number of oral
            manifestations.
                                                          Number of oral manifestations
                                            0           1           2           3           4        p value
                                           n (%)       n (%)       n (%)       n (%)      n (%)

                                 1        1 (14.3)    1 (11.1)    0 (0.0)     1 (10.0)    2 (40.0)
            OHI-s †              2        5 (71.4)    6 (66.7)    10 (90.9)   8 (80.0)    1 (20.0)    0.603
                                 3        1 (14.3)    2 (22.2)    1 (9.1)     1 (10.0)    2 (40.0)


                                Yes       3 (42.9)    4 (40.0)    9 (69.2)    8 (66.7)    2 (33.3)
            Dental appointment                                                                        0.821
            before CT ‡
                                No        4 (57.1)    6 (60.0)    4 (30.8)    4 (33.3)    4 (66.7)


            Dental appointment   Yes      1 (14.3)    1 (10.0)    0 (0.0)     3 (25.0)    0 (0.0)     0.987
            during CT ‡
                                No        6 (85.7)    9 (90.0)   13 (100.0)   9 (75.0)   6 (100.0)
                         ‡
           †  Kruskal-Wallis test;   Mann-Whitney U test; OHI-s, simplified oral hygiene index; CT, chemotherapy.


             The quality of life during CT was significantly associated   Regarding the first aim of the study, many oral manifesta-
           with the number of oral manifestations (p=0.002) (Table 4). The   tions and symptoms were found in onco-hematology patients
           value of the Pearson ρ was 0.521 (p<0.001), indicating a mod-  during CT. One study  had reported that, after one week of CT
                                                                              5
           erate correlation between these two variables, which means   treatment, oral symptoms increased, with mucositis, pain,
           that patients whose quality of life was more affected had a   dysphagia, mouth and lip dryness, dysgeusia, gingival bleeding
           higher number of oral manifestations.              and the ability to talk being frequently reported. The same oral
             The number of oral manifestations was not associated with   manifestations were found in the present study as well as in
           the presence of dental debris and calculus (p=0.603) nor with the   others. 18,19  Oral ulcers were reported by one-third of the study
           use of dental services before CT (p= 0.821) or during CT (p=0.987)   participants but observed in one-quarter. This prevalence of
                                                                                                             20
           (Table 5). There was also a negative correlation, although not   oral ulcers is much higher than that of patients not doing CT.
           statistically significant (p=0.25), between the number of oral   In a previous study, this condition increased by 22% during the
                                                                     5
           manifestations and the oral hygiene instructions received.  CT cycle.  Gingival inflammation and red/white lesions were
                                                              also more frequent in the onco-hematology patients of this
                                                                                    20
                                                              study than healthy subjects.  Mucositis was observed in about
           Discussion                                         one-fifth of the sample, while other studies had reported high-
                                                              er and lower frequencies of mucositis. 7,19  Difficulty in feeding
           This observational study was conducted in an adult popula-  was less observed in the present study as compared to others. 5
           tion undergoing CT, to investigate the oral manifestations and   Several CT-related side effects are dependent on the phase
           symptoms during CT and whether oral health routines influ-  of the treatment. In the consolidating phase, where the ther-
           ence  the  patient’s  experience  of  oral  manifestations  and   apy is intensified, the most common complications are muco-
           symptoms and their quality of life.                sitis, dysgeusia, xerostomia, bleeding, oral pain, opportunistic

