


Page 33 - SPEMD_60-3
P. 33
rev port estomatol med dent cir maxilofac . 2019;60(3):118-124         121


            Table 1. Manifestations felt and observed during    Table 2. Decayed, missing and filled teeth (DMFT) index
            chemotherapy.                                       and simplified oral hygiene index (OHI-s).
                                  Felt changes  Observed changes                Minimum Maximum  Mean    Std.
                                     n (%)         n (%)                                                Deviation
            Xerostomia              33 (71.7)                   Decayed teeth (n=47)  0   11      1.57   2.20
            Ulcers/sores            14 (30.4)     11 (22.4)     Missing teeth (n=47)  0   23      5.62   6.47
            Infection               1 (2.2)                     Filled teeth (n=47)  0    18      3.91   4.54
            Tooth mobility          6 (12.2)                    DMFT (n=47)        0      26     11.11   6.48
            Hypersensitivity        18 (39.1)                   DI-s (n=42)       0.16     2      1.06   0.52
            Halitosis               9 (18.4)      12 (24.5)     CI-s (n=42)        0       3      1.18   0.52
            Loss of appetite        14 (30.4)                   OHI-s (n=42)      0.5      5     2.24    0.94
            Candidiasis             5 (102)                    DI-s, simplified debris index; CI-s, simplified calculus index.
            White/red lesions       1 (2.2)       4 (8.2)
            Mucositis               0 (0.0)       9 (18.4)     very good and 18.4% as bad. Eleven patients (22.4%) rated
                                                               their quality of life as worst during CT (p=0.001; sign rank
            Herpes simplex infection  1 (2.2)     0 (0.0)
                                                               test).
            Tooth decay             1 (2.2)       20(42.6)       The utilization of dental services before starting CT was
                                                               reported by 53.1% of the patients compared to 10.2% during
            Dysgeusia               22 (47.8)
                                                               CT. Concerning patients that had already finished previous
            Gingival changes        11 (23.9)     38 (77.6)    cycles of CT, 53.8% of them had visited the dentist after the
                                                               completion of the cycle.
            Mouth soreness          7 (15.2)
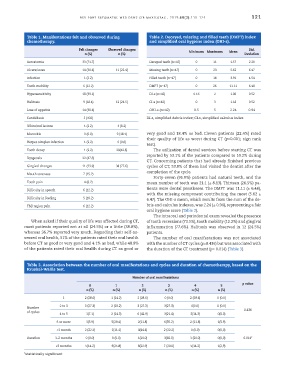
                                                                 Forty-seven (95.9%) patients had natural teeth, and the
            Tooth pain              4 (8.2)                    mean number of teeth was 21.1 (± 8.13). Thirteen (26.5%) pa-
                                                               tients wore dental prostheses. The DMFT was 11.11 (± 6.48),
            Difficulty in speech    6 (12.2)
                                                               with the missing component contributing the most (5.62 ±
            Difficulty in feeding   5 (10.2)                   6.47). The OHI-s mean, which results from the sum of the de-
            TMJ region pain         6 (12.2)                   bris and calculus indexes, was 2.24 (± 0.94), representing a fair
                                                               oral hygiene score (Table 2).
                                                                 The intraoral and periodontal exam revealed the presence
              When asked if their quality of life was affected during CT,   of tooth recessions (73.5%), tooth mobility (12.2%) and gingival
           most patients reported not at all (24.5%) or a little (38.8%),   inflammation (77.6%). Halitosis was observed in 12 (24.5%)
           whereas 36.7% reported very much. Regarding their self-as-  patients.
           sessed oral health, 51% of the patients rated their oral health   The number of oral manifestations was not associated
           before CT as good or very good and 4.1% as bad, while 40.8%   with the number of CT cycles (p=0.436) but was associated with
           of the patients rated their oral health during CT as good or   the duration of the CT treatment (p= 0.014) (Table 3).


            Table 3. Association between the number of oral manifestations and cycles and duration of chemotherapy, based on the
            Kruskal-Wallis test.
                                                         Number of oral manifestations
                                      0          1          2          3          4           5        p value
                                     n (%)      n (%)      n (%)      n (%)      n (%)      n (%)
                           1         2 (28.6)   1 (14.2)   2 (28.6)   0 (0.0)    2 (28.6)   0 (0.0)
                          2 to 3     3 (27.3)   2 (18.2)   3 (27.3)   3(27.3)    0(0.0)     0 (0.0)
            Number                                                                                     0.436
            of cycles
                          4 to 5     1(7.1)     2 (14.3)   6 (42.9)   3(21.4)    2(14.3)    0(0.0)
                         6 or more   1(5.9)     5(29.4)    2(11.8)    6(35.2)    2 (11.8)   1(5.9)
                         <1 month    2 (22.2)   1(11.1)    4(44.4)    2 (22.2)   0 (0.0)    0(0,0)
            Duration    1–2 months   0 (0.0)    0 (0.0)    1(20.0)    3(60.0)    1 (20.0)   0(0,0)     0.014*
                        ≥3 months    5(14.2)    9(25.8)    8(22.9)    7 (20.0)   5(14.2)    1(2,9)
           *statistically significant

