


Page 27 - SPEMD_60-3
P. 27
rev port estomatol med dent cir maxilofac . 2019;60(3):111-117         115


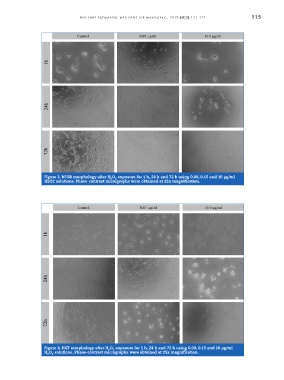
                    Figure 3. hFOB morphology after H O  exposure for 1 h, 24 h and 72 h using 0.00, 0.15 and 10 μg/ml
                                                 2
                                               2
                    H2O2 solutions. Phase-contrast micrographs were obtained at 25x magnification.


                    Figure 4. HGF morphology after H O  exposure for 1 h, 24 h and 72 h using 0.00, 0.15 and 10 μg/ml
                                              2
                                                2
                    H O  solutions. Phase-contrast micrographs were obtained at 25x magnification.
                     2
                       2

