


Page 26 - SPEMD_60-3
P. 26
114                    rev port estomatol med dent cir maxilofac. 2019;60(3):111-117


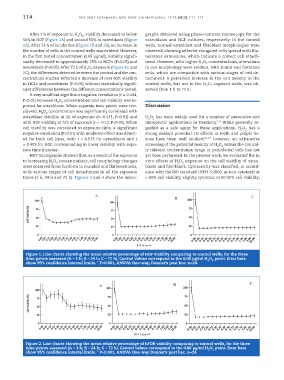
             After 1 h of exposure to H O , viability decreased to below   graphs obtained using phase-contrast microscopy for the
                                  2  2
           50% in HGF (Figure 1A) and around 50% in osteoblasts (Figure   osteoblasts and HGF cultures, respectively. In the control
           2A). After 24 h of incubation (Figure 1B and 2B), an increase in   wells, normal osteoblast and fibroblast morphologies were
           the number of cells in the control wells was evident. However,   observed, showing adhered elongated cells spread with fila-
           in the first tested concentration (0.05 µg/ml), viability signifi-  mentous extensions, which indicate a correct cell attach-
           cantly decreased to approximately 25% in HGFs (P<0.05) and   ment. However, with higher H O  concentrations, alterations
                                                                                      2
                                                                                       2
           osteoblasts (P<0.05). After 72 h of H O  exposure (Figure 1C and   in cell morphology were evident, with round and flattened
                                     2  2
           2C), the differences detected between the control and the con-  cells, which are compatible with various stages of cell de-
           centrations studied reflected a decrease of over 80% viability   tachment. A perceived increase in the cell density in the
           in HGFs and osteoblasts (P<0.05) without statistically signifi-  control wells, but not in the H O -exposed wells, was ob-
                                                                                         2
                                                                                       2
           cant differences between the different concentrations tested.  served from 1 h to 72 h.
             A very small but significant negative correlation (r =-0.164,
           P<0.01) between H O  concentration and cell viability was re-
                         2  2
           ported for osteoblasts. When separate time points were con-  Discussion
           sidered, H O  concentration was significantly correlated with
                  2  2
           osteoblast viability at 1h of exposure (r=-0.471, P<0.01) and   H O  has been widely used for a number of preventive and
                                                               2
                                                                 2
           with HGF viability at 72h of exposure (r = -0.12, P<0.05). When   therapeutic applications in Dentistry. 1-6  While generally re-
           cell viability was correlated to exposure time, a significant   garded as a safe agent for these applications, H O  has a
                                                                                                        2
                                                                                                      2
           negative correlation (P<0.01) with moderate effect was detect-  strong oxidant potential. Its effects in teeth and pulpal tis-
           ed for both cell lines, with r =-0.573 for osteoblasts and r   sues have been well studied; 22-27  however, an exhaustive
           =-0.403 for HGF, corresponding to lower viability with expo-  screening of the potential toxicity of H O  within the clinical-
                                                                                            2  2
           sure time increase.                                ly relevant concentration range in periodontal cells has not
             HGF micrographs showed that, as a result of the exposure   yet been performed. In the present work, we evaluated the in
           to increasing H O  concentrations, cell morphology changes   vitro effects of H O  exposure on the cell viability of osteo-
                                                                            2
                                                                             2
                         2
                       2
           were observed from fusiform to rounded and flattened cells,   blasts and fibroblasts. Cytotoxicity was classified, in accord-
           with various stages of cell detachment in all the exposure   ance with the ISO standard 10993-5:2009, as non-cytotoxic at
           times (1 h, 24 h and 72 h). Figures 3 and 4 show the micro-  > 80% cell viability; slightly cytotoxic at 80-50% cell viability;


            Figure 1. Line charts showing the mean relative percentage of HGF viability comparing to control wells, for the three
            time points assessed (A – 1 h; B – 24 h; C – 72 h). Control values correspond to the 0.00 μg/ml H O  point. Error bars
                                                                                          2
                                                                                        2
            show 95% confidence interval limits. * P<0.001, ANOVA One-way, Dunnet’s post hoc. n=24


            Figure 2. Line charts showing the mean relative percentage of hFOB viability comparing to control wells, for the three
            time-points assessed (A – 1 h; B – 24 h; C – 72 h). Control values correspond to the 0.00 μg/ml H O  point. Error bars
                                                                                        2
                                                                                          2
            show 95% confidence interval limits. * P<0.001, ANOVA One-way Dunnet’s post hoc. n=24

