


Page 25 - SPEMD_60-3
P. 25
rev port estomatol med dent cir maxilofac . 2019;60(3):111-117         113


           using osteoblasts, H O has been described as inhibiting osteo-  during clinical treatment and, thus, IC50 assessment was not
                          2  2
                                                20
           blastic differentiation and inducing bone loss.  Previous re-  performed. The solutions were diluted with an appropriate me-
           ports have focused on high H O concentrations, but the re-  dium according to the cell line. Cells were incubated with H O
                                   2  2                                                                     2  2
           sponse of periodontal tissue cells to low-dose H O  (lower than   solutions for 1 h, 24 h and 72 h, and, in order to simulate clin-
                                                2
                                                 2
           10 µg/ml), as observed in clinical conditions (peri-implantitis   ical conditions, solutions were not renovated, and culture me-
           treatment, diffusion during whitening procedures), has not   dia alone was used as control. Each group had a final sample
           been described.                                     size of 24 wells, based on triplicate assays of n=8 wells each.
              The aim of this study was to evaluate the cytotoxicity of   Cytotoxicity was assessed based on cell viability and pro-
           H O solutions with different concentrations on periodontal   liferation assays using a 20% resazurin solution (Sigma-Al-
            2  2
           cells, using fibroblast and osteoblast cell lines. The secondary   drich, St. Louis, MO, USA), according to the ability of living cells
           aims were to assess the effect of the H O concentration on   to irreversibly convert a redox dye (resazurin) into a fluores-
                                           2  2
           cell viability and cell morphology in different exposure times.   cent final product (resorufin). The conversion rate was mea-
           The null hypotheses to be tested were: 1) Exposure to H O  sured as the fluorescence intensity after 1 h, 24 h and 72 h of
                                                         2  2
           does not decrease osteoblast viability; 2) Exposure to H O does   culture. After incubation at 37°C for 3 h, a cell-viability assay
                                                     2
                                                       2
           not decrease gingival fibroblast viability; 3) H O concentration   was performed following the manufacturer’s instructions, and
                                              2  2
           is not correlated with osteoblast viability; 4) H O concentra-  the fluorescence intensity was recorded at excitation/emission
                                                  2
                                                2
           tion is not correlated with gingival fibroblast viability.  wavelengths of 560/590 nm in a luminescence spectrometer
                                                               (PerkinElmer LS 50B, Waltham MA, USA). The results were ex-
                                                               pressed in arbitrary units (A.U.). The mean of three consecutive
           Material and methods                                measurements in each well was considered as the final result.
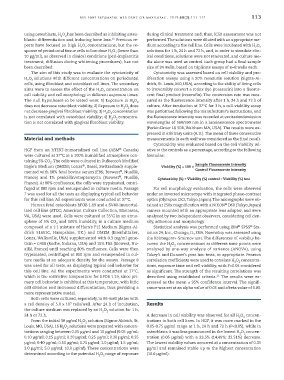
                                                                 Cytotoxicity was evaluated based on the cell viability rel-
           HGF  from  an  hTERT-immortalized  cell  line  (ABM   Canada)   ative to the controls as a percentage, according to the following
                                                   ®
           were cultured at 37°C in a 100% humidified atmosphere con-  formulas:
           taining 5% CO . The cells were cultured in Dulbecco’s Modified
                      2
                                    ®
           Eagle’s Medium (DMEM; Lonza , Basel, Switzerland) supple-  Viability (%) = 100 ×  Sample Fluorescente Intensity
           mented with 10% fetal bovine serum (FBS; Biowest , Nuaillé,             Control Fluorescente Intensity
                                                   ®
                                                   ®
           France) and 1% penicillin/streptomycin (Biowest , Nuaillé,   Cytotoxicity (%) = Viability (%) control – Viability (%) test
           France). At 80% confluence, the cells were trypsinated, centri-
           fuged at 800 rpm and resuspended in culture media. Passage   For cell morphology evaluation, the cells were observed
           7 was used for all the tests as displaying typical cell behavior   under an inverted microscope with integrated phase-contrast
           for this cell line. All experiments were conducted at 37°C.  optics (Olympus CK2, Tokyo, Japan). The micrographs were ob-
                                                                                               ®
              Human fetal osteoblasts hFOB 1.19 and a SV40-immortal-  tained at 250x magnification with a NIKON  D60 (Tokyo, Japan)
           ized cell line (ATCC; American Culture Collection, Manassas,   camera mounted with an appropriate lens adapter, and were
           VA, USA) were used. Cells were cultured at 35°C in an atmo-  analyzed by two independent observers, considering cell den-
           sphere of 5% CO  and 100% humidity, in a culture medium   sity, adhesion and morphology.
                         2
           composed of a 1:1 mixture of Ham’s F12 Medium (Sigma-Al-  Statistical analysis was performed using IBM  SPSS  Sta-
                                                                                                          ®
                                                                                                     ®
           drich 51651C, Hampshire, UK.) and DMEM (Biowhittaker,   tistics 24, Inc., Chicago, IL, EUA. Normality was assessed using
           Lonza, Walksville, USA) supplemented with 0.3 mg/ml gene-  the Kolmogorov-Smirnov test. The differences of viability be-
           ticin – G418 (Roche, Indiana, USA) and 10% FBS (Biowest, Nu-  tween the H O  concentrations at different time points were
                                                                        2  2
           aillé, France) until reaching 80% confluence. Cells were then   analyzed by one-way analysis of variance (ANOVA), using
           trypsinated, centrifuged at 800 rpm and resuspended in cul-  Tukey’s and Dunnet’s post hoc tests, as appropriate. Pearson
           ture media at an adequate density for the assays. Passage 8   correlation coefficients were used to correlate H O concentra-
                                                                                                   2
                                                                                                     2
           was used for all tests, as displaying typical cell behavior for   tions, exposure time and cell viability, with P<0.05 considered
           this cell line. All the experiments were conducted at 37ºC,   as significant. The strength of the resulting correlations was
                                                                                            21
           which is the restrictive temperature for hFOB 1.19, since pri-  described using established criteria.  The results were ex-
           mary cell behavior is exhibited at this temperature, with little   pressed as the mean ± 95% confidence interval. The signifi-
           cell division and increased differentiation, thus providing a   cance was set at an alpha value of 0.05 and a beta value of 0.80.
           more representative model.
              Both cells were cultured, separately, in 96-well plates with
                              3
           a cell density of 5.0 x 10  cells/well. After 24 h of incubation,   Results
           the culture medium was replaced by an H O  solution for 1 h,
                                            2  2
           24 h or 72 h.                                       A decrease in cell viability was observed for all H O  concen-
                                                                                                     2
                                                                                                       2
              From the initial 30 µg/ml H O  solution (Sigma-Aldrich, St.   trations in both cell lines. In HGF, it was more marked in the
                                   2  2
           Louis, MO, USA), 16 H O  solutions were prepared with concen-  0.05-0.75 µg/ml range at 1 h, 24 h and 72 h (P<0.05), while in
                             2
                           2
           trations ranging between 0.05 µg/ml and 10 µg/ml (0.05 µg/ml;   osteoblasts it was less pronounced in the lowest H O concen-
                                                                                                     2  2
           0.10 µg/ml; 0.15 µg/ml; 0.20 µg/ml; 0.25 µg/ml; 0.30 µg/ml; 0.35   tration (0.05 µg/ml) with a 23.5% (14.49%; 32.51%) decrease.
           µg/ml; 0.40 µg/ml; 0.50 µg/ml; 0.75 µg/ml; 1.0 µg/ml; 1.5 µg/ml;   The lowest viability values occurred at a concentration of 0.35
           3.0 µg/ml; 5.0 µg/ml; 10.0 µg/ml). These concentrations were   µg/ml and remained stable up to the highest concentration
           determined according to the potential H O range of exposure   (10.0 µg/ml).
                                          2  2

