
Page 19 - SPEMD_59-2
P. 19
rev port estomatol med dent cir maxilofac . 2018;59(2):75-79 77
Table 1. Descriptive analysis: mean and standard
deviation regarding number of cycles to fracture (NCF).
Group 1 is the one with higher mean values; the lower
values are present in Group 4.
Group Type of file Mean ± St. Deviation
1 PTG F2 549.1 ± 115.1
2 PTU F2 283.5 ± 33.9
NCF
3 PTG F3 294.5 ± 88.0
4 PTU F3 158.5 ± 37.57
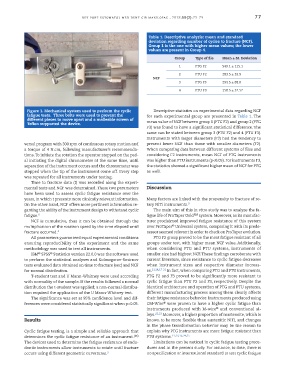
Figure 1. Mechanical system used to perform the cyclic Descriptive statistics on experimental data regarding NCF
fatigue tests. Three bolts were used to prevent the for each experimental group are presented in Table 1. The
different pieces to move apart and a malleable screen of
Teflon supported the device. mean value of NCF between group 1 (PTG F2) and group 2 (PTG
F3) was found to have a significant statistical difference. The
same can be stated between group 3 (PTU F2) and 4 (PTU F3).
Instruments with larger diameters (F3) had the tendency to
versal program with 300 rpm of continuous rotary motion and present lower NCF than those with smaller diameters (F2).
a torque of 4 N.cm, following manufacturer’s recommenda- When comparing data between different systems of files and
tions. To initiate the rotation the operator stepped on the ped- considering F2 instruments, mean NCF of PTG instruments
al initiating the digital chronometer at the same time, until was higher than PTU instruments (p<0.05). For instruments F3,
separation of the instrument occurs and the chronometer was the statistics showed a significant higher mean of NCF for PTG
stopped when the tip of the instrument come off. Every step as well.
was repeated for all instruments under testing.
Time to fracture data (t) was recorded along the experi-
mental tests and NCF was determined. These two parameters Discussion
have been used to assess cyclic fatigue resistance over the
years, in which t presents more clinically relevant information. Many factors are linked with the propensity to fracture of ro-
On the other hand, NCF offers more pertinent information re- tary NiTi instruments. 9
garding the ability of the instrument design to withstand cyclic The main aim of this in vitro study was to analyze the fa-
fatigue. 6 tigue life of ProTaper Gold RM system. Moreover, as its manufac-
NCF is cumulative, thus it can be obtained through the turer proclaimed improved fatigue resistance of this system
multiplication of the rotation speed by the time elapsed until over ProTaper Universal system, comparing it with its prede-
®
fracture occurred. 4 cessor seemed relevant in order to check on ProTaper evolution.
All parameters guaranteed equal experimental conditions PTG F2 group proved to be the most fatigue resistant of all
ensuring reproducibility of the experiment and the same groups under test, with higher mean NCF value. Additionally,
methodology was used to test all instruments. when considering PTG and PTU systems, instruments of
®
®
IBM SPSS Statistics version 22.0.0 was the software used smaller size had highest NCF. These findings corroborate with
to perform the statistical analyses and Kolmogorov-Smirnov current literature, since resistance to cyclic fatigue decreases
tests evaluated data obtained on time to fracture (sec) and NCF when instrument sizes and respective diameter increas-
for normal distribution. es. 11,14,17-21 In fact, when comparing PTG and PTU instruments,
T-student test and U Mann-Whitney were used according PTG F2 and F3 proved to be significantly more resistant to
with normality of the sample. If the results followed a normal cyclic fatigue than PTU F2 and F3, respectively. Despite the
distribution the t-student was applied; a non-normal distribu- identical architecture and operation of PTG and PTU systems,
tion required the application of the U Mann-Whitney test. different manufacturing process among them clearly affects
The significance was set at 95% confidence level and dif- their fatigue resistance behavior. Instruments produced using
ferences were considered statistically significant when p<0.05. CM-Wire were proven to have a higher cyclic fatigue than
®
®
instruments produced with M-wire and conventional al-
loys. 22,23 Moreover, a higher proportion of martensite, which is
Results known to be more flexible than austenitic NiTi, and changes
in the phase transformation behavior may be the reason to
Cyclic fatigue testing, is a simple and reliable approach that explain why PTG instruments are more fatigue resistant than
determines the cyclic fatigue resistance of an instrument. (16) PTU systems. 11,13,16,24,25
The devices used to determine the fatigue resistance of endo- Limitations can be noticed in cyclic fatigue testing proce-
dontic instruments allow instruments to rotate until fracture dures and in the present study. For instance, to date, there is
occurs using different geometric curvatures. 3 no specification or international standard to test cyclic fatigue