
Page 28 - SPEMD_58-4
P. 28
216 rev port estomatol med dent cir maxilofac. 2017;58(4):212-218
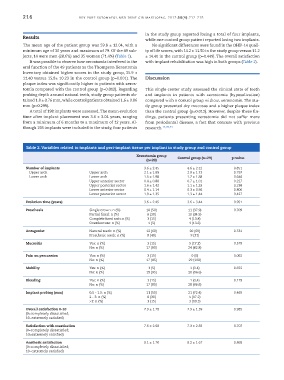
in the study group reported losing a total of four implants,
Results
while one control group patient reported losing two implants.
The mean age of the patient group was 59.8 ± 12.04, with a No significant differences were found in the OHIP-14 quali-
minimum age of 30 years and maximum of 79. Of the 49 sub- ty of life scores, with 14.2 ± 11.50 in the study group versus 11.2
jects, 14 were men (28.6%) and 35 women (71.4%) (Table 1). ± 14.40 in the control group (p=0.449). The overall satisfaction
It was possible to observe how xerostomia interfered in the with implant rehabilitation was high in both groups (Table 2).
oral function of the 49 patients as the Thompson Xerostomia
Inventory obtained higher scores in the study group, 35.9 ±
11.40 versus 15.8± 10.23 in the control group (p=0.001). The Discussion
plaque index was significantly higher in patients with xeros-
tomia compared with the control group (p=0.012). Regarding This single-center study assessed the clinical state of teeth
probing depth around natural teeth, study group patients ob- and implants in patients with xerostomia (hyposalivation)
tained 1.8 ± 0.76 mm, while control patients obtained 1.6 ± 0.86 compared with a control group without xerostomia. The stu-
mm (p=0.299). dy group presented dry mucosas and a higher plaque index
A total of 198 implants were assessed. The mean evolution than the control group (p=0.012). However, despite these fin-
time after implant placement was 3.6 ± 3.04 years, ranging dings, patients presenting xerostomia did not suffer more
from a minimum of 6 months to a maximum of 12 years. Al- from periodontal disease, a fact that concurs with previous
though 198 implants were included in the study, four patients research. 12,20,24
Table 2. Variables related to implants and peri-implant tissue per implant in study group and control group
Xerostomia group Control group (n=29) p-value
(n=20)
Number of implants 3.6 ± 2.45 4.6 ± 2.12 0.851
Upper arch Upper arch 2.1 ± 1.89 2.9 ± 1.73 0.797
Lower arch Lower arch 1.5 ± 1.98 1.7 ± 1.88 0.646
Upper anterior sector 0.4 ± 0.88 0.7 ± 1.01 0.227
Upper posterior sector 1.6 ± 1.42 1.1 ± 1.33 0.238
Lower anterior sector 0.4 ± 1.14 0.3 ± 0.86 0.806
Lower posterior sector 1.0 ± 1.35 1.3 ± 1.44 0.427
Evolution time (years) 3.6 ± 2.45 3.6 ± 3.44 0.951
Prosthesis Single crown: n (%) 10 (50) 11 (37.9) 0.709
Partial fixed: n (%) 6 (30) 10 (34.5)
Complete fixed arch: n (%) 3 (15) 4 (13.8)
Overdenture: n (%) 1 (5) 4 (13.8)
Antagonist Natural teeth: n (%) 12 (60) 20 (69) 0.531
Prosthetic teeth: n (%) 8 (40) 9 (31)
Mucositis Yes: n (%) 3 (15) 5 (17.2) 0.579
No: n (%) 17 (85) 24 (82.8)
Pain on percussion Yes: n (%) 3 (15) 0 (0) 0.062
No: n (%) 17 (85) 29 (100)
Mobility Yes: n (%) 1 (5) 1 (3.4) 0.655
No: n (%) 19 (95) 28 (96.6)
Bleeding Yes: n (%) 3 (15) 1 (3.4) 0.179
No: n (%) 17 (85) 28 (96.6)
Implant probing (mm) 0.5 - 1.5: n (%) 11 (55) 21 (72.4) 0.465
2 - 3: n (%) 6 (30) 5 (17.2)
>3: n (%) 3 (15) 3 (10.3)
Overall satisfaction 0-10 7.9 ± 1.78 7.9 ± 1.59 0.985
(0=completely dissatisfied;
10=extremely satisfied)
Satisfaction with mastication 7.6 ± 2.08 7.3 ± 2.33 0.707
(0=completely dissatisfied;
10=extremely satisfied)
Aesthetic satisfaction 8.1 ± 1.70 8.2 ± 1.67 0.868
(0=completely dissatisfied;
10=extremely satisfied)