
Page 27 - SPEMD_58-4
P. 27
rev port estomatol med dent cir maxilofac . 2017;58(4):212-218 215
presence/absence of signs of inflammation in the mucosa mulated in response to a theoretical model of oral health, and
around it (such as redness, dehiscence or altered form), pain provides scores ranging from 0 to 56, with higher scores indi-
on percussion and mobility (yes/no). cating a poorer quality of life. 24
Sialometry was performed to measure the overall saliva In addition, overall patient satisfaction with implant-su-
at rest using the drainage technique. Patients were instruc- pported prostheses was assessed in terms of aesthetics and
ted not to eat, drink, smoke, chew, or perform oral hygiene masticatory function, using a visual analog scale (VAS) scoring
in the 60 min before the saliva collection using the drainage 0-10 (0 = completely dissatisfied; 10 = extremely satisfied). Sub-
technique. 22 jects were asked to mark a vertical line through a 10-cm hori-
Samples were collected following a standardized 15-minu- zontal line to indicate their level of satisfaction.
te procedure between 9 a.m. and 12 p.m., and an unstimulated Data were analyzed using the SPSS 19.0 statistics pro-
®
salivary flow of ≤1.5mm/15 min was considered positive. gram (SPSS Inc, Chicago, IL, USA). A descriptive study was
23
The Thompson Xerostomia Inventory was applied to as- made for each variable. The Kolmogorov-Smirnov normality
sess xerostomia symptoms; the inventory consists of 11 items test and Levene’s homogeneity of variance test were applied;
referring to the four weeks previous to the conduction of the data showed a skewed distribution, and so were analyzed
test and evaluates the frequency of dry mouth symptoms. using a non-parametric ranking test. The associations be-
Patients’ quality of life was assessed using the OHIP-14 tween the different qualitative variables were studied using
(Oral Health Impact Profile) questionnaire (Spanish version), Pearson’s chi-square test. A p≤0.05 was accepted as statisti-
which consists of 14 questions assessing seven domains for- cally significant.
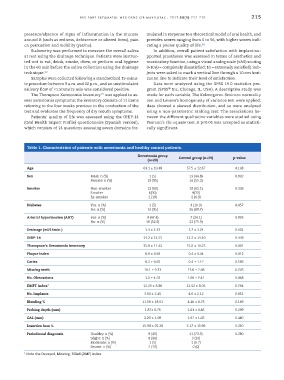
Table 1. Characteristics of patients with xerostomia and healthy control patients.
Xerostomia group Control group (n=29) p-value
(n=20)
Age 63.1 ± 10.48 57.5 ± 12.67 0.108
Sex Male: n (%) 1 (5) 13 (44.8) 0.002
Female: n (%) 19 (95) 16 (55.2)
Smoker Non-smoker 12 (60) 18 (62.1) 0.339
Smoker 6(30) 9(31)
Ex-smoker 2 (10) 2 (6.9)
Diabetes Yes: n (%) 1 (5) 3 (10.3) 0.457
No: n (%) 19 (95) 26 (89.7)
Arterial hypertension (AHT) Yes: n (%) 9 (47.4) 7 (24.1) 0.095
No: n (%) 10 (52.6) 22 (75.9)
Drainage (ml/15min ) 1.4 ± 1.43 3.7 ± 1.24 0.001
OHIP-14 14.2 ± 11.55 11.2 ± 14.40 0.449
Thompson’s Xerostomia Inventory 35.9 ± 11.42 15.8 ± 10.23 0.001
Plaque index 0.9 ± 0.58 0.4 ± 0.44 0.012
Caries 0.3 ± 0.65 0.4 ± 1.12 0.586
Missing teeth 10.1 ± 9.13 11.0 ± 7.08 0.743
No. Obturations 3.0 ± 4.26 1.00 ± 1.41 0.068
DMFT index* 13.25 ± 8.80 12.52 ± 8.03 0.764
No. Implants 3.60 ± 2.45 4.6 ± 2.12 0.851
Bleeding % 11.58 ± 18.01 4.46 ± 8.75 0.169
Probing depth (mm) 1.87± 0.76 1.61 ± 0.86 0.299
CAL (mm) 2.25 ± 1.08 1.97 ± 1.03 0.440
Insertion loss % 15.90 ± 25.30 7.17 ± 15.96 0.250
Periodontal diagnosis Healthy: n (%) 9 (45) 11 (73.3) 0.280
Slight: n (%) 8 (40) 3 (20)
Moderate: n (%) 1 (5) 1 (6.7)
Severe: n (%) 2 (10) 0 (0)
* Note the Decayed, Missing, Filled (DMF) index