Page 31 - SPEMD_58-2
P. 31
rev port estomatol med dent cir maxilofac . 2017;58(2):79-90 87
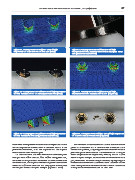
Figure 22. Correspondence between the damage Figure 25. Correspondence between the damage
sequences on both studies: 16% of FEA (resin). sequences on both studies: 4000 N on interrupted static
test (prosthetic framework).
Figure 23. Correspondence between the damage sequences Figure 26. Correspondence between the damage
on both studies: 3000 N on interrupted static test (resin). sequences on both studies: 56% of FEA (implants).
Figure 24. Correspondence between the damage sequences Figure 27. Correspondence between the damage sequences
on both studies: 48% of FEA (prosthetic framework). on both studies: final static test (implants).
static tests, it was possible to determine the sequence in which The results of the simulation of a clinical scenario are de-
the model parts are affected: First is the resin, second is the picted on the Tables 4 and 5. Table 4 shows the results of the
prosthetic framework, third the implants and the implant metallic components, comparing the measured stress with the
screws are the most resistant part. yield strength of each material. The stresses found on the dif-
On the FEA model, the resin reached the calculated yield ferent components are very similar, reaching around 50% or
strength with 16% of the load. With 48% of the applied load, less of the yield strength. Table 5 shows the results of the bone
the stress on the prosthetic framework connectors overcame part, considered as an orthotropic material, highlighting the
the elastic limit. The implants reached the plastic deformation stresses and microstrains obtained for each Cartesian coordi-
zone for a 56% of the total load and the implant screws were nate. The higher value for stress was found on the Z axis while
the last part to reach the yield strength (Figures 22 to 29). the higher microstrain was found on the Y axis.