Page 30 - SPEMD_58-2
P. 30
86 rev port estomatol med dent cir maxilofac. 2017;58(2):79-90
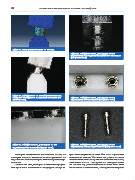
Figure 16. Stress pattern observed on the FEA.
Figure 19. Damage observed, part by part, on the
experimental: model prosthetic framework connectors
(completed SCLT).
Figure 17. Damage found on the completed static test.
Compared with figure 16 it is possible to observe the Figure 20. Damage observed, part by part, on the
same tendency. experimental model: implants (completed SCLT).
Figure 18. Damage observed, part by part, on the Figure 21. Damage observed, part by part, on the
experimental model: resin (completed SCLT). experimental model: implant screws (completed SCLT).
To compare the sequence of events on both models, the quence on the experimental model. With 3000N only the resin
interrupted static load tests results where compared with the suffered small fractures. With 4000N was possible to observe
step increment in which, each part, reached the yield strength an initial deformation of the prosthetic framework connectors,
on the FEA. more evident at 5000N. The implants and the implant screws
The static load tests, interrupted in a sequence of progres- did not show any plastic deformation for these loads. Based
sive higher loads, contributed to clarifying the damage se- on the results obtained on both, interrupted and completed