
Page 10 - SPEMD_61-2
P. 10
48 rev port estomatol med dent cir maxilofac. 2020;61(2):45-51
0 -10), ii) fatigue and muscle tension (NRS classification from -normal distribution (p<0.001). Whenever data were analyzed
0 -10), iii) adverse events. The clinician calibrated each EMG with this variable, non -parametric tests were used. The EMG/h,
device individually on day 0, and each participant adjusted pain score, and TI data were described. Baseline (1st week –
stimulus intensity for CES daily. Bas) data was used to evaluate the correlation between pain
14
The EMG device uses a signal recognition algorithm score and EMG activity or TI parameters for the entire sample
based on the signals collected from three electrode contacts. using the appropriate tests (Pearson’s coefficient or Spear-
An EMG episode is recorded when the amplitude of the EMG man’s rho tests). Multiple comparisons between variable
signal exceeds the pre -defined threshold of more than 100 ms means were performed using a t -test with the Bonferroni cor-
for up to 1s. Longer -lasting EMG events are counted as addi- rection. The level of significance was set at 5%.
tional events. The EMG activity was expressed as the number
22
of grinds per hour of sleep (NG), by previously established
methods. Briefly every night, participants were requested to Results
relax their jaw muscles for 10 s and then clench their teeth at
approximately 60% of the maximum voluntary contraction for A total of 48 patients were randomly allocated to one of the
10s (verbal explanation, with clinical counseling and visual groups, and there were no dropouts throughout the study.
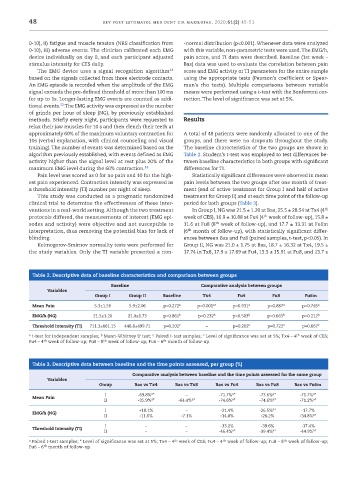
training). The number of events was determined based on the The baseline characteristics of the two groups are shown in
algorithm previously established, with events defined as EMG Table 2. Student’s t -test was employed to test differences be-
activity higher than the signal level at rest plus 20% of the tween baseline characteristics in both groups with significant
maximum EMG level during the 60% contraction. 14 differences for TI.
Pain level was scored as 0 for no pain and 10 for the high- Statistically significant differences were observed in mean
est pain experienced. Contraction intensity was expressed as pain levels between the two groups after one month of treat-
a threshold intensity (TI) number per night of sleep. ment (end of active treatment for Group I and half of active
This study was conducted as a pragmatic randomized treatment for Group II) and at each time point of the follow -up
clinical trial to determine the effectiveness of these inter- period for both groups (Table 3).
th
ventions in a real -world setting. Although the two treatment In Group I, NG was 21.5 ± 1.20 at Bas, 25.5 ± 28.54 at Tx4 (4
th
protocols differed, the measurements of interest (EMG epi- week of CES), 16.9 ± 10.88 at Fu4 (4 week of follow -up), 15.8 ±
th
sodes and activity) were objective and not susceptible to 11.6 at Fu8 (8 week of follow -up), and 17.7 ± 13.31 at Fu6m
th
interpretation, thus removing the potential bias for lack of (6 month of follow -up), with statistically significant differ-
blinding. ences between Bas and Fu8 (paired samples, t -test, p<0.05). In
Kolmogorov -Smirnov normality tests were performed for Group II, NG was 21.0 ± 1.75 at Bas, 18.7 ± 16.32 at Tx4, 19.5 ±
the study variables. Only the TI variable presented a non- 17.74 in Tx8, 17.9 ± 17.69 at Fu4, 15.5 ± 15.91 at Fu8, and 13.7 ±
Table 2. Descriptive data of baseline characteristics and comparison between groups
Baseline Comparative analysis between groups
Variables
Group I Group II Baseline Tx4 Fu4 Fu8 Fu6m
Mean Pain 5.3±1.56 5.9±2.06 p=0.272 a p=0.001 * p=0.931 a p=0.887 a p=0.745 a
a
EMG/h (NG) 21.5±1.20 21.0±1.75 p=0.861 b p=0.232 b p=0.503 b p=0.665 b p=0.212 b
Threshold Intensity (TI) 711.3±661.15 448.8±499.71 p=0.202 c – p=0.202 c p=0.722 c p=0.667 c
a t -test for independent samples; Mann -Whitney U test; Paired t -test samples; * Level of significance was set at 5%; Tx4 – 4 week of CES;
th
b
c
th
th
th
Fu4 – 4 week of follow -up; Fu8 – 8 week of follow -up; Fu6 – 6 month of follow -up.
Table 3. Descriptive data between baseline and the time points assessed, per group (%)
Comparative analysis between baseline and the time points assessed for the same group
Variables
Group Bas vs Tx4 Bas vs Tx8 Bas vs Fu4 Bas vs Fu8 Bas vs Fu6m
a
a
a
a
I -69.8% * – -71.7% * -73.6% * -71.7% *
Mean Pain a a a a a
II -35.9% * -64.4% * -74.6% * -74.6% * -71.2% *
I +18.1% – -21.4% -26.5% * -17.7%
a
EMG/h (NG)
a
II -11.0% -7.1% -14.8% -26.2% -34.8% *
I – – -33.2% -39.6% -37.4%
Threshold Intensity (TI)
a
II – – -46.4% * -39.4% * -44.9% *
a
a
th
th
th
a Paired t -test samples; * Level of significance was set at 5%; Tx4 – 4 week of CES; Fu4 – 4 week of follow -up; Fu8 – 8 week of follow -up;
th
Fu6 – 6 month of follow -up.