
Page 20 - SPEMD_59-1
P. 20
12 rev port estomatol med dent cir maxilofac. 2018;59(1):10-17
Materials and methods
Information was obtained using a questionnaire that was
completed by children from 3 to 11 years old who attended
the S. Miguel Primary School (Escola Básica de S. Miguel), in Vi-
zela, and another questionnaire that was completed by the
corresponding parents/guardians for validation of the an-
swers. To create the data extraction form and write the paper, No. Respondents
the authors conducted a comprehensive literature review us-
ing the PubMed and Cochrane databases, as well as the Virtu-
al Library of the University of Porto, introducing and combin-
ing the following keywords “recurrent aphthous stomatitis”,
“gastrointestinal”, “trauma”, “questionnaire”, “inquiry” and
“questions”. The following inclusion criteria were defined for
the selection of the articles: full text available, publication in
the last 5 years, and article written in English, Portuguese or
Spanish. Subsequently, studies essential for a better under- Age (years)
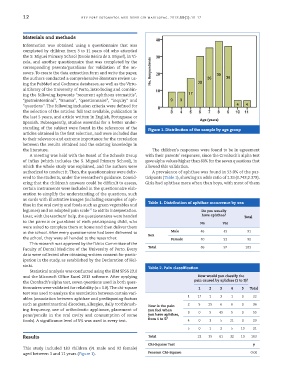
standing of the subject were found in the references of the Figure 1. Distribution of the sample by age group
articles obtained in the first selection, and were included due
to their relevance and extreme importance for the correlation
between the results obtained and the existing knowledge in
the literature. The children’s responses were found to be in agreement
A meeting was held with the Board of the Schools Group with their parents’ responses, since the Cronbach’s alpha test
of Infias (which includes the S. Miguel Primary School), in gave alpha values higher than 80% for the seven questions that
which the whole study was explained, and the authors were allowed this validation.
authorized to conduct it. Then, the questionnaires were deliv- A prevalence of aphthae was found in 53.0% of the par-
ered to the students, under the researcher’s guidance. Consid- ticipants (Table 1), showing an odds ratio of 1.33 (0.743;2.378).
ering that the children’s answers could be difficult to assess, Girls had aphthae more often than boys, with most of them
certain instruments were included in the questionnaire elab-
oration to simplify the understanding of the questions, such
as cards with illustrative images (including examples of aph-
thae in the oral cavity and foods such as green vegetables and Table 1. Distribution of aphthae occurrence by sex
22
legumes) and an adapted pain scale to aid its interpretation. Do you usually
Later, with the teachers’ help, the questionnaires were handed have aphthae? Total
to the parents or guardians of each participating child, who No Yes
were asked to complete them at home and then deliver them
at the school. After every questionnaire had been delivered to Sex Male 46 45 91
the school, they were all handed to the researcher. Female 40 52 92
This research was approved by the Ethics Committee of the
Faculty of Dental Medicine of the University of Porto. Every Total 86 97 183
data were collected after obtaining written consent for partic-
ipation in the study, as established by the Declaration of Hel-
sinki. Table 2. Pain classification
Statistical analysis was conducted using the IBM SPSS 23.0
and the Microsoft Office Excel 2013 software. After applying How would you classify the
the Cronbach’s alpha test, seven questions used in both ques- pain caused by aphthae (1 to 5)?
tionnaires were validated for reliability (α > 0.8). The chi-square 1 2 3 4 5 Total
test was used to analyze the association between certain vari-
ables (association between aphthae and predisposing factors 1 17 1 3 1 0 22
such as gastrointestinal disorders, allergies, daily toothbrush- How is the pain 2 5 25 6 0 0 36
ing frequency, use of orthodontic appliance, placement of you feel when
pens/pencils in the oral cavity and consumption of some you have aphthae, 3 0 5 45 5 0 55
foods). A significance level of 5% was used in every test. from 1 to 5? 4 0 3 5 21 0 29
5 0 1 2 5 13 21
Results Total 22 35 61 32 13 163
Chi-Square Test p
This study included 183 children (91 male and 92 female)
aged between 3 and 11 years (Figure 1). Pearson Chi-Square 0.00